
Page 70 - How to Make Money in Stocks Trilogy
P. 70
America’s Greatest Stock-Picking Secrets 31
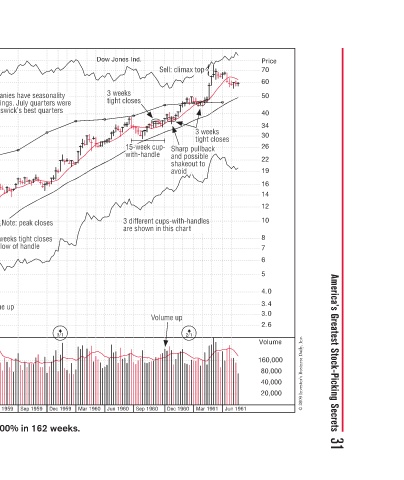
Price 70 60 50 40 34 30 26 22 19 16 14 12 10 8 7 6 5 4.0 3.4 3.0 2.6 Volume 160,000 80,000 40,000 20,000 © 2009 Investor’s Business Daily, Inc.
Jun 1961
e
3 weeks e tight closes tight closes l c k k c es es Mar 1961
Sell: climax top Sell: climax to m Se S - c S d and possible p a shakeout to k s avoid avoid i a 3 different cups-with-handle 3 different cups-with-handl l h w p are shown in this chart a t Volume up p m V 2/1 Dec 1960
op top top p w ih Sharp pullback Sharp pullback b p b s o u a
Dow Jones Ind. 3 weeks 3 weeks k k w w t tight closes s c h 5-week cup- 15-week cup- e 15-w 15-w - 15 with-handle a t e i 3 o a Sep 1960 Jun 1960
Mar 1960
e o r w e r a e s s e 3/1 Dec 1959
Some companies have seasonality Some companies have seasonality h o to their earnings. July quarters were J e always Brunswick’s best quarters q q q ’ B ote: peak closes Note: peak closes No No N 4 weeks tight closes 4 weeks tight closes in low of handle in low of handle f p Volume
y
y
y
Buy Buy u k cup- k cup- 16-week cup p week cu k 16 1 1 h-handle h-han n with-ha Vo 13/10 Mar 1959 Dec 1958 Sep 1958
g
Company has new product - t p e py a automatic pin-spotters for bowling p a alleys. Consumer wins again. Consumer wins again a r alleys 1957 Bear Market 1957 Bear Market a Buy y Buy Buy a k Base-on-base Base B p p Volume up Volume up e 25-week cup-with-handle e h c 2/1 Jun 1
Brunswick–1958 Weekly Chart Big earnings gs n g acceleration a quarter quarter q Heavy volume supportat u v H closes in upper part bottom, closes in upper part t t n m bottom b b of price range for the week of price range for the week r e Sep 1957 Jun 1957 Mar 1957
Price = 20*eps 3.50 3.00 2.50 2.25 2.00 1.80 1.60 1.50 1.40 1.30 1.20 1.10 1.00 0.90 0.80 0.75 0.70 0.65 0.60 0.55 0.50 0.45 0.40 0.35 0.30 0.25 0.23 0.20 0.18 0.16 0.15 0.14 0.13 0.12