Page 748 - How to Make Money in Stocks Trilogy
P. 748

Breaking Boards: Successful Trades and Lessons Learned  47


           Price  Scale  120  100  80      60      40        3,600,000  2,700,000  1,800,000  900,000  © 2012 Investor’s Business Daily, Inc.
                                                            Volume

                                                RS Line               17


                                                                       August
                                                                      3

                                                                      20

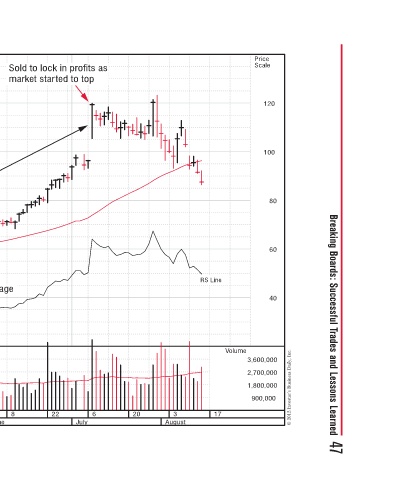
             Sold to lock in profits as   market started to top       6  22  July


                            66% gain             50-day moving average  8  25  June


                                                                       May 11
               commercial markets in the United States, Europe, and Asia
            First Solar Inc (FSLR)—Daily Chart 2006–2007
              Manufactures and sells solar modules for residential and
                                                                      27
                                  Bought on earnings gap-up  Huge volume on gap-up  13  30  April


                 Gennady Kupershteyn                                  16  2  16  March
   743   744   745   746   747   748   749   750   751   752   753