Page 750 - How to Make Money in Stocks Trilogy
P. 750

© 2012 Investor’s Business Daily, Inc.
                                                                  3,600,000
                                                               5,400,000
                                                             7,200,000
                                                                    1,800,000
            Scale
           Price
                                                    2.6
                                                   2.8
                                                  3.0
                                                     2.4
                                                      2.2
                                                       2.0
                                                         1.6
                                              4.2
                                             4.6
                                                        1.8
                                                 3.4
                                                3.8
                          24
                           22
                   46
                    42
                  50
              70
                60
                        28
                         26
                        30
                     38
                      34
                                            5
                                       8
                                      9
                                        7
                                          6
                                                            Volume
                      40-week moving average
                                                                      Jun 10
                                      with support at 10-week
                                              Shaken out quickly with
                                     Bought stock in July
                                                                      Mar 10
               Sold stock 2 weeks later
                                        moving average
                 as market came under
                                                stock’s volatility
                                                                      Dec 09
                   heavy selling
                                                                      Sep 09
                          52% gain
                                                                      Jun 09
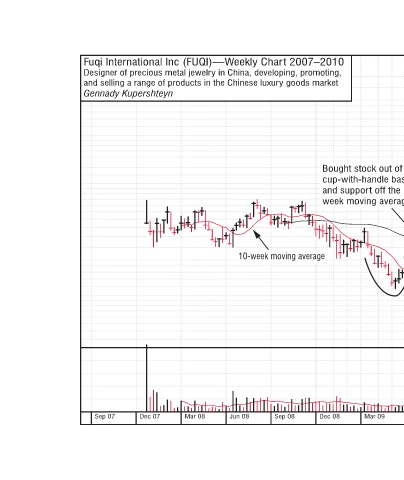
                             Bought stock out of   19  17 cup-with-handle base   15  14 and support off the 10-   13  12 week moving average  11  10  Breaking Boards: Successful Trades and Lessons Learned  49
                                                                      Mar 09
            Fuqi International Inc (FUQI)—Weekly Chart 2007–2010
              Designer of precious metal jewelry in China, developing, promoting,
                                                                      Dec 08
               and selling a range of products in the Chinese luxury goods market
                                            10-week moving average    Sep 08  Jun 08
                                                                      Mar 08
                 Gennady Kupershteyn                                  Dec 07  Sep 07
   745   746   747   748   749   750   751   752   753   754   755