Page 811 - How to Make Money in Stocks Trilogy
P. 811

88
        HOW TO MAKE MONEY IN STOCKS SUCCESS STORIES
                                   35
                             40
                                                               1,500,000
                                                             2,000,000
                                                     20
                                               25
                                         30
                 50
                       45
                                                                 1,000,000
                                                                   500,000
            Scale
           Price
                                                            Volume
                                              RS Line
                                                  200-day moving average
                 Sold at $42.05 to lock in gains
                                        50-day moving average
                        25% gain
                                                                       February 20  6  22  8  25  11  27  13  30  16  2  17  © 2012 Investor’s Business Daily, Inc.  July  June  May  April  March
                                                                      3
                                                                      20  6  January
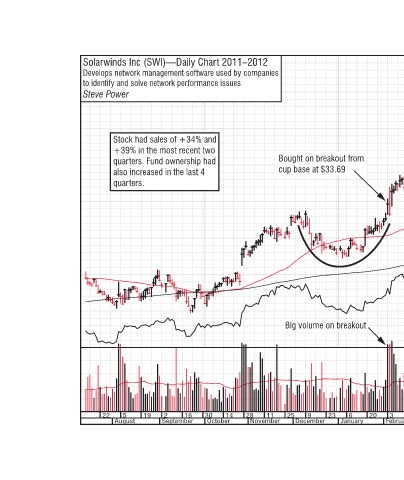
                            Bought on breakout from   cup base at $33.69  Big volume on breakout  23 25 December 9  11  November
            Solarwinds Inc (SWI)—Daily Chart 2011–2012 Develops network management software used by companies  to identify and solve network performance issues  Steve Power  Stock had sales of +34% and  +39% in the most recent two  quarters. Fund ownership had  also increased in the last 4   quarters.  28  14  30
   806   807   808   809   810   811   812   813   814   815   816