
Page 807 - How to Make Money in Stocks Trilogy
P. 807
Breaking Boards: Successful Trades and Lessons Learned 85
26 24 22 20 18 16 © 2012 Investor’s Business Daily, Inc.
Price Scale 4,000,000 3,000,000 2,000,000 1,000,000
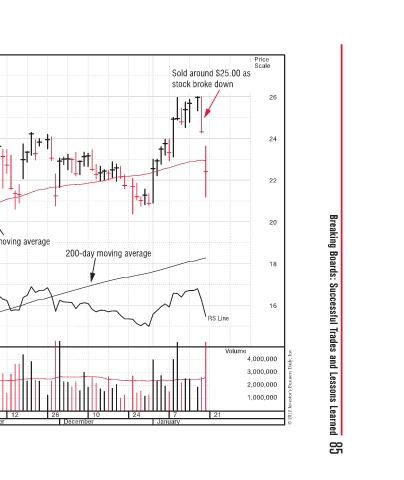
Sold around $25.00 as stock broke down RS Line Volume 21
January 7
200-day moving average 24 10
26 December
50-day moving average 12
35% gain 29 November
15 1 October
RS line in new high ground
Aruba Networks Inc (ARUN)—Daily Chart 2010–2011 Provides enterprise mobility software that enables secure access to data, voice, and video applications Paramjit Chumber Bought at around $18.50 out of a consolidation Huge volume on breakout day 17 3 20 6 23 September August