
Page 836 - How to Make Money in Stocks Trilogy
P. 836
© 2012 Investor’s Business Daily, Inc.
60,000,000
120,000,000
180,000,000
240,000,000
Scale
1000
1100
1500
Price
1400
1200
1300
150
170
190
140
100
120
130
800
700
900
110
70
60
50
38
34
46
42
90
80
Volume
Sep 12
430% gain from initial buy
Jun 12
to September 2012
Mar 12
Dec 11
Sep 11
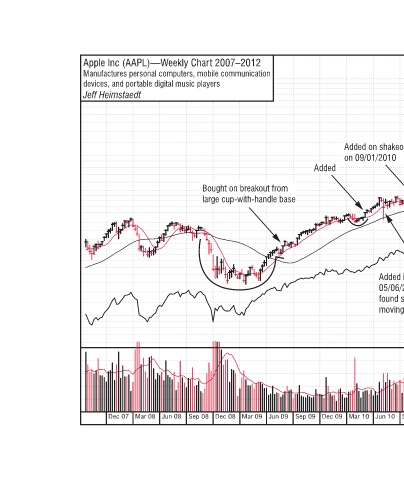
Added on breakout from
flat-base on 07/15/2011
Jun 11
Mar 11
05/06/2010 as stock found
found support at 40-week
Added in flash crash on
Dec 10
moving average
Added on shakeout +3 600 500 on 09/01/2010 460 420 380 340 300 Added on breakout from 280 260 cup-with-handle base 240 220 RS Line Breaking Boards: Successful Trades and Lessons Learned 105
Sep 10
Jun 10
Mar 10
Added Dec 09
Sep 09 Jun 09 Mar 09
large cup-with-handle base
Bought on breakout from
Apple Inc (AAPL)—Weekly Chart 2007–2012 Manufactures personal computers, mobile communication devices, and portable digital music players Jeff Heimstaedt Dec 08 Sep 08 Jun 08 Mar 08 Dec 07