
Page 905 - How to Make Money in Stocks Trilogy
P. 905
Black Belt Trading: Investing Like a Pro 159
240,000,000
180,000,000
120,000,000
60,000,000
Scale
Price
140
150
130
100
110
120
260
280
300
240
190
170
220
19
22
24
30
28
26
13
12
10
17
15
14
34
60
50
46
90
80
70
38
42
11
7
8
9
Volume
Sold remainder of position on bad
break of 10-week moving average
Sold portion of position on break
of 10-week moving average
stock split (203% gain)
Reduced position on
118% gain
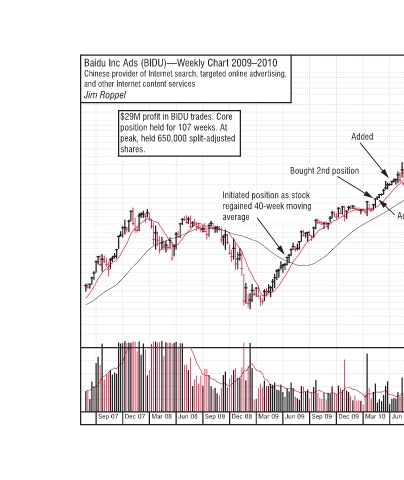
Added
Mar 10 Sep 12 Jun 12 Mar 12 Dec 11 Sep 11 Jun 11 Mar 11 Dec 10 Sep 10 Jun 10 © 2012 Investor’s Business Daily, Inc.
Added Dec 09
Bought 2nd position Initiated position as stock regained 40-week moving Sep 09 Jun 09 Mar 09
Baidu Inc Ads (BIDU)—Weekly Chart 2009–2010 Chinese provider of Internet search, targeted online advertising, and other Internet content services Jim Roppel $29M profit in BIDU trades. Core position held for 107 weeks. At peak, held 650,000 split-adjusted shares. average Dec 08 Sep 08 Jun 08