Page 908 - How to Make Money in Stocks Trilogy
P. 908

© 2012 Investor’s Business Daily, Inc.
                                                                 16,000,000
                                                               24,000,000
                                                             32,000,000
                                                                   8,000,000
            Scale
           Price
                 340
                   300
                     260
                    280
              460
             500
                380
               420
                                                      14
                                                     15
                                                        12
                                                       13
                                                    17
                                                24
                                                 22
                                                   19
                                                         11
                                                            Volume
                                                                      Sep 12
              Sold here and locked in gains
                                                                      Jun 12
                                                                      Mar 12
                                                                      Dec 11
                                                                      Sep 11
               Bought back recent sells on regain
                                                                      Jun 11
                of 10-week moving average
                                                                      Mar 11
                                                                      Dec 10
                                                                      Sep 10
                                                                      Jun 10
                       Initiated position on breakout  240  220  190  170  150  140  130  120 Sold portion of position   110  100 on bad break of 10-week   90 moving average  80  70  60  50 Pyramided into position  46  42  38  34  30  28  26  Black Belt Trading: Investing Like a Pro 161
                                                                      Mar 10
                                                                      Dec 09
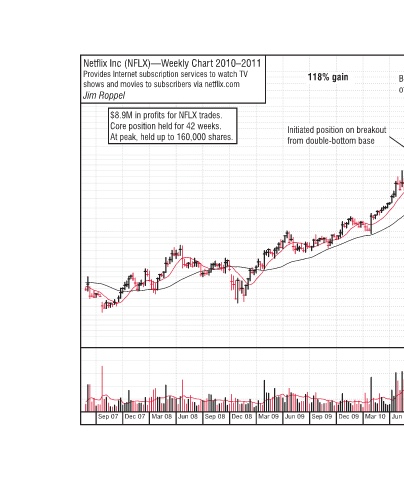
              118% gain  from double-bottom base                      Sep 09
                                                                      Mar 09  Jun 09  Dec 08
            Netflix Inc (NFLX)—Weekly Chart 2010–2011 Provides Internet subscription services to watch TV  shows and movies to subscribers via netflix.com  Jim Roppel  $8.9M in profits for NFLX trades.  Core position held for 42 weeks.  At peak, held up to 160,000 shares.  Sep 08  Jun 08  Mar 08  Dec 07  Sep 07
   903   904   905   906   907   908   909   910   911   912   913