
Page 27 - TCS ICT Book 6
P. 27
The City School 2021-2022
Adding Legends to Charts
Most charts use some kind of a legend to help readers understand the charted
data. Whenever you create a chart in Excel, a legend for the chart is automatically
generated at the same time. A chart can be missing a legend if it has been manually
removed from the chart, but you can retrieve the missing legend. Analysing Data
To add legends to your charts, follow the steps below:
1. Click the chart.
2. Click + Chart Elements next to
the table. Alternatively, you can
select Chart Elements from the
ribbon above.
3. Select the Legend checkbox.
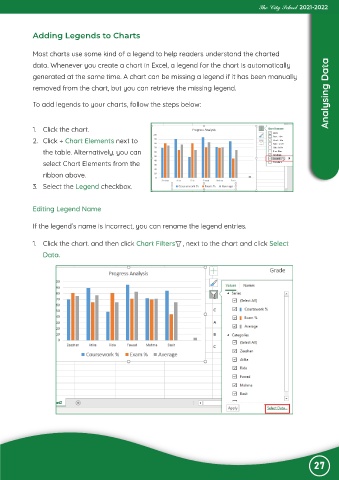
Editing Legend Name
If the legend’s name is incorrect, you can rename the legend entries.
1. Click the chart. and then click Chart Filters , next to the chart and click Select
Data.
27