Page 185 - MARSIUM'21 COMP OF PAPER
P. 185

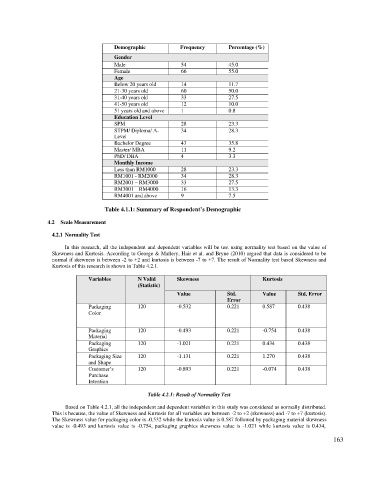
Demographic           Frequency       Percentage (%)
                                       Gender
                                       Male                  54              45.0
                                       Female                66              55.0
                                       Age
                                       Below 20 years old    14              11.7
                                       21-30 years old       60              50.0
                                       31-40 years old       33              27.5
                                       41-50 years old       12              10.0
                                       51 years old and above   1            0.8
                                       Education Level
                                       SPM                   28              23.3
                                       STPM/ Diploma/ A-     34              28.3
                                       Level
                                       Bachelor Degree       43              35.8
                                       Master/ MBA           11              9.2
                                       PhD/ DBA              4               3.3
                                       Monthly Income
                                       Less than RM1000      28              23.3
                                       RM1001 - RM2000       34              28.3
                                       RM2001 – RM3000       33              27.5
                                       RM3001 – RM4000       16              13.3
                                       RM4001 and above      9               7.5

                                    Table 4.1.1: Summary of Respondent’s Demographic

                 4.2  Scale Measurement

                  4.2.1 Normality Test

                      In this research, all the independent and dependent variables will be test using normality test based on the value of
                  Skewness and Kurtosis. According to George & Mallery, Hair et al. and Bryne (2010) argued that data is considered to be
                  normal if skewness is between ‐2 to +2 and kurtosis is between ‐7 to +7. The result of Normality test based Skewness and
                  Kurtosis of this research is shown in Table 4.2.1.

                              Variables        N Valid      Skewness                    Kurtosis
                                               (Statistic)
                                                            Value           Std.        Value       Std. Error
                                                                            Error
                              Packaging        120          -0.532          0.221       0.587       0.438
                              Color


                              Packaging        120          -0.493          0.221       -0.754      0.438
                              Material
                              Packaging        120          -1.021          0.221       0.434       0.438
                              Graphics
                              Packaging Size   120          -1.131          0.221       1.270       0.438
                              and Shape
                              Customer’s       120          -0.893          0.221       -0.074      0.438
                              Purchase
                              Intention

                                                  Table 4.2.1: Result of Normality Test

                       Based on Table 4.2.1, all the independent and dependent variables in this study was considered as normally distributed.
                  This is because, the value of Skewness and Kurtosis for all variables are between -2 to +2 (skewness) and -7 to +7 (kurtosis).
                  The Skewness value for packaging color is -0.532 while the kurtosis value is 0.587 followed by packaging material skewness
                  value  is -0.493  and kurtosis value  is  -0.754, packaging graphics  skewness  value  is  -1.021 while  kurtosis value is 0.434,

                                                                                                               163
   180   181   182   183   184   185   186   187   188   189   190