
Page 184 - MARSIUM'21 COMP OF PAPER
P. 184
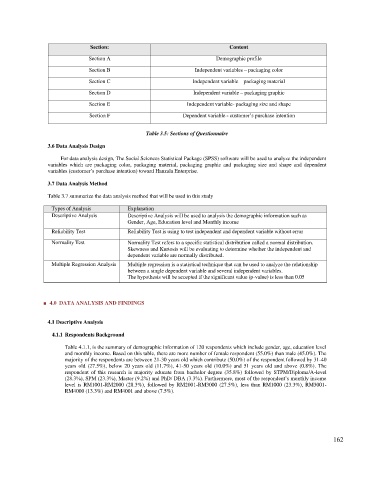
Section:                                      Content
                              Section A                                  Demographic profile

                              Section B                           Independent variables – packaging color
                              Section C                          Independent variable – packaging material
                              Section D                          Independent variable – packaging graphic

                               Section E                       Independent variable- packaging size and shape
                               Section F                      Dependent variable - customer’s purchase intention


                                                 Table 3.5: Sections of Questionnaire

                 3.6 Data Analysis Design

                     For data analysis design, The Social Sciences Statistical Package (SPSS) software will be used to analyze the independent
                 variables  which  are  packaging  color,  packaging  material,  packaging  graphic  and  packaging  size  and  shape  and  dependent
                 variables (customer’s purchase intention) toward Hanzala Enterprise.

                 3.7 Data Analysis Method

                 Table 3.7 summarize the data analysis method that will be used in this study

                  Types of Analysis        Explanation
                  Descriptive Analysis     Descriptive Analysis will be used to analysis the demographic information such as
                                           Gender, Age, Education level and Monthly income
                  Reliability Test         Reliability Test is using to test independent and dependent variable without error
                  Normality Test           Normality Test refers to a specific statistical distribution called a normal distribution.
                                           Skewness and Kurtosis will be evaluating to determine whether the independent and
                                           dependent variable are normally distributed.
                  Multiple Regression Analysis   Multiple regression is a statistical technique that can be used to analyze the relationship
                                           between a single dependent variable and several independent variables.
                                           The hypothesis will be accepted if the significant value (p-value) is less than 0.05


               ■  4.0  DATA ANALYSIS AND FINDINGS


                 4.1 Descriptive Analysis

                  4.1.1 Respondents Background

                      Table 4.1.1, is the summary of demographic information of 120 respondents which include gender, age, education level
                      and monthly income. Based on this table, there are more number of female respondent (55.0%) than male (45.0%). The
                      majority of the respondents are between 21-30 years old which contribute (50.0%) of the respondent followed by 31-40
                      years  old  (27.5%),  below  20  years  old  (11.7%), 41-50  years old  (10.0%)  and  51 years  old  and  above  (0.8%).  The
                      respondent  of  this  research  is  majority  educate  from  bachelor  degree  (35.8%)  followed  by  STPM/Diploma/A-level
                      (28.3%), SPM (23.3%), Master (9.2%) and PhD/ DBA (3.3%). Furthermore, most of the respondent’s monthly income
                      level  is  RM1001-RM2000  (28.3%),  followed by  RM2001-RM3000  (27.5%),  less  than  RM1000  (23.3%),  RM3001-
                      RM4000 (13.3%) and RM4001 and above (7.5%).


                                                                                                               162