
Page 843 - MARSIUM'21 COMP OF PAPER
P. 843
844
exploratory research design is qualitative data and the process of exploratory research is comparatively less organized and more flexible.
Conversely, conclusive research design refers to a study that produces conclusions for decision making as it examines the hypotheses and
relationships among each variable (Neelankavil, 2015).
The data collected in conclusive research is in the quantitative form and the method is more organized. Exploratory research is the
primary method before conducting the conclusive study as it identifies the possible relationships between variables for future studies to relate
(Burman, 2009). Meanwhile, conclusive research design can be categorized into descriptive and causal research. A descriptive study
examines the characteristics of samples, whereas a causal study investigates the cause-and-effect relationship between variables (Omair,
2015). Causal study assesses the impacts of one or more variables on the value of other variables which is commonly used as experimental
studies (Zikmund et al., 2012). Researchers test and control the set of independent variables to find out if they have any effect on the
dependent variables. The descriptive research can be divided into cross-sectional and longitudinal design where cross sectional studies are
conducted among different samples at a time while longitudinal studies investigate the same sample along the research process (Omair,
2015). Hence, this study adopts the conclusive research design which consists of descriptive research and cross-sectional design to study
the relationships between usability, ease of use, entertainment, complementarity, e-trust, and online booking intention in field services.
3.2 POPULATION AND SAMPLING
From research perspectives, a population is a group of people or items who have similar and distinct features in which the researcher
uses them to draw a conclusion for a study (Abutabenjeh, 2018). In this study, the target population consists of residential and commercial
property owners, tenants and tender in Malaysia. Davis (2011) and Memon et al. (2020) suggested that the sample size of 150 is sufficient
to conduct a study and draw conclusions. Mooi et al. (2018) also stated that a carefully selected small sample, preferably 150 and above more
relevant than a randomly selected large sample since the strength of samples is determined by sample selection accuracy rather than sample
size. Moreover, (Showkat and Parveen, 2017) stated that non-probability sampling method is widely used and most convenient sampling of
selecting a sample to study exisiting theroritcal insights or developing new ones. Hence, this study adopted the non-probability sampling
approach using the purposive sampling technique because the target respondent was residential property owners and tenants in Johor.. This
study chose property owners and tenants because they were the target market of home maintenance services industry. Furthermore, the
respondents must have been visited any home maintenance service provider websites such as ‘Kaodim.my’ or Servishero.my’ in order to
answer the survey.
3.3 RESEARCH INSTRUMENT
Quantitative technique is used for this study and questionnaire instrument is employed to collect the primary data from the
respondents online in the format of Google Forms. The questionnaire consists of two sections: Section A and Section B. In Section A, there
are seven questions regarding the demographic profiles of respondents such as the age, gender, residential area in Johor, monthly income,
education level, common booking channel, and booking experience. Section B consists of thirty-two questions with twenty-two questions
are related to the website quality in affecting the booking intention, such as usability, ease of use, entertainment, and complementarity while
the remaining ten questions are about the trust towards the proposed online booking. The measurement items were adapted and adopted from
the study of Li et al. (2017). Moreover, 5-point Likert Scale is enacted in Section B of the questionnaire ranging from 1 (Strongly Disagree),
2 (Disagree), 3 (Neutral), 4 (Agree), and finally to 5 (Strongly Agree). After the data collection phase, the collected data is tested, processed,
and analyzed by using the Statistical Package for the Social Sciences (SPSS).
■ 4.0 DATA ANALYSIS
st
th
Data were collected using online survey between 1 July 2021 and 30 October 2021. A total of 330 respondents from multiple
online platforms primarily Facebook and WhatsApp were collected using the survey via Google Form. The usable responses are 150 which
are equivalent to the minimum sample size of the study. The valid responses were identified from a qualifying question where respondents
must have been visited any home maintenance service provider websites such as ‘Kaodim.my’ or Servishero.my’ to answer the survey. The
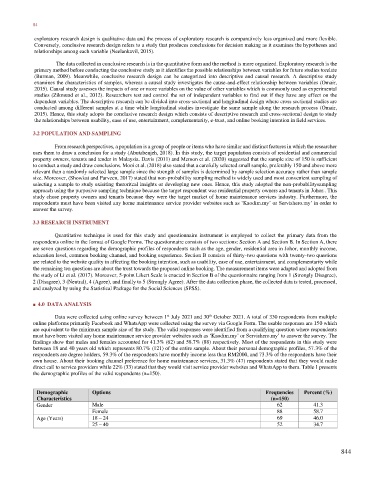
findings show that males and females accounted for 41.3% (62) and 58.7% (88) respectively. Most of the respondents in this study were
between 18 and 40 years old which represents 80.7% (121) of the entire sample. About their personal demographic profiles, 57.3% of the
respondents are degree holders, 59.3% of the respondents have monthly income less than RM2000, and 73.3% of the respondents have their
own house. About their booking channel preference for home maintenance services, 31.3% (47) respondents stated that they would make
direct call to service providers while 22% (33) stated that they would visit service provider websites and WhatsApp to them. Table 1 presents
the demographic profiles of the valid respondents (n=150).
Demographic Options Frequencies Percent (%)
Characteristics (n=150)
Gender Male 62 41.3
Female 88 58.7
Age (Years) 18 – 24 69 46.0
25 – 40 52 34.7
844