
Page 145 - ssr_16
P. 145
The capacity of the water-storage tank has been increased to provide uninterrupted
water supply. Minor repairs required are communicated to the Principal who
instructs the manager to take necessary action.
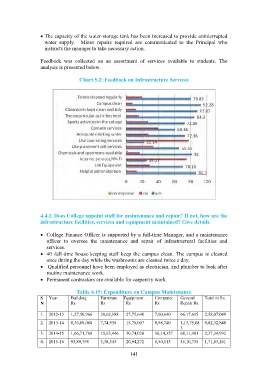
Feedback was collected on an assortment of services available to students. The
analysis is presented below.
Chart 5.2: Feedback on Infrastructure Services
4.4.2. Does College appoint staff for maintenance and repair? If not, how are the
infrastructure facilities, services and equipment maintained? Give details.
College Finance Officer is supported by a full-time Manager, and a maintenance
officer to oversee the maintenance and repair of infrastructural facilities and
services.
40 full-time house-keeping staff keep the campus clean. The campus is cleaned
once during the day while the washrooms are cleaned twice a day.
Qualified personnel have been employed as electrician, and plumber to look after
routine maintenance work.
Permanent contractors are available for carpentry work.
Table 4.19: Expenditure on Campus Maintenance
S Year Building Furniture Equipment Computer General Total in Rs.
N Rs Rs Rs Rs Repair Rs.
1. 2012-13 1,27,50,966 29,62,188 27,75,640 7,00,640 66,17,615 2,58,07,049
2. 2013-14 8,36,08,080 7,74,938 15,76,007 8,98,740 1,13,75,08 9,82,32,848
3
3. 2014-15 1,06,71,760 15,63,446 30,74,028 16,14,357 68,11,401 2,37,34,992
4. 2015-16 93,89,798 3,38,343 20,94,272 8,50,113 45,10,735 1,71,83,261
141