
Page 163 - ssr_16
P. 163
5.2.1. Provide details of the programme-wise success rate of College for the last four
years. How does College compare itself with the performance of other
autonomous Colleges/Universities if possible?
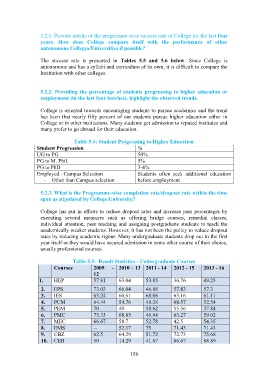
The success rate is presented in Tables 5.5 and 5.6 below. Since College is
autonomous and has a syllabi and curriculum of its own, it is difficult to compare the
Institution with other colleges.
5.2.2. Providing the percentage of students progressing to higher education or
employment (in the last four batches), highlight the observed trends.
College is oriented towards encouraging students to pursue academics and the trend
has been that nearly fifty percent of our students pursue higher education either in
College or in other institutions. Many students get admission to reputed institutes and
many prefer to go abroad for their education.
Table 5.4: Student Progressing to Higher Education
Student Progression %
UG to PG 50%
PG to M. Phil. 5%
PG to PhD 3-4%
Employed - Campus Selection Students often seek additional education
- Other than Campus selection before employment
5.2.3. What is the Programme-wise completion rate/dropout rate within the time
span as stipulated by College/University?
College has put in efforts to reduce dropout rates and increase pass percentages by
executing several measures such as offering bridge courses, remedial classes,
individual attention, peer teaching and assigning postgraduate students to teach the
academically weaker students. However, it has not been the policy to reduce dropout
rates by reducing academic rigour. Many undergraduate students drop out in the first
year itself as they would have secured admission in some other course of their choice,
usually professional courses.
Table 5.5: Result Statistics - Undergraduate Courses
Courses 2009 - 2010 – 13 2011 - 14 2012 - 15 2013 - 16
12
1. HEP 57.81 63.04 53.85 36.76 49.23
2. EPS 73.02 66.04 46.88 57.83 57.3
3. IES 63.24 60.61 68.06 63.16 61.11
4. PCM 64.44 54.76 48.28 68.57 52.54
5. PEM 70 40 58.62 55.56 37.84
6. PMC 73.33 68.85 46.94 63.27 59.02
7. MEC 66.67 58.7 52.78 42.5 54.35
8. EMS -- 52.17 75 71.43 71.43
9. CBZ 62.5 64.29 51.72 72.73 75.68
10. CEB 50 14.29 41.67 66.67 88.89
158