
Page 164 - ssr_16
P. 164
11. CEZ 27.27 59.09 72.22 83.33 62.5
12. MCB 70.59 50 50 66.67 53.33
13. MCZ 81.25 77.78 65.22 57.5 64.44
14. CBBT 52.08 70.59 46.88 65.79 50
15. CZBT -- -- -- -- 44.44
16. BSW 73.53 73.68 82.35 55.26 74.42
17. BCA 82.54 78.69 64.52 85.48 68.85
18. BVC -- 74.19 72.73 75 79.41
19. EJP -- -- -- -- 75
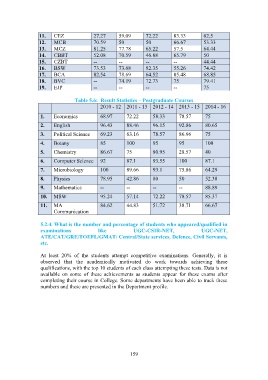
Table 5.6: Result Statistics – Postgraduate Courses
2010 - 12 2011 - 13 2012 - 14 2013 - 15 2014 - 16
1. Economics 68.97 72.22 58.33 78.57 75
2. English 96.43 88.46 96.15 92.86 80.65
3. Political Science 69.23 63.16 78.57 86.96 75
4. Botany 85 100 95 95 100
5. Chemistry 86.67 75 80.95 28.57 40
6. Computer Science 92 87.1 93.55 100 87.1
7. Microbiology 100 89.66 93.1 75.86 64.29
8. Physics 78.95 42.86 80 50 52.38
9. Mathematics -- -- -- -- 88.89
10. MSW 95.24 57.14 72.22 78.57 85.37
11. MA 84.62 44.83 51.72 38.71 66.67
Communication
5.2.4. What is the number and percentage of students who appeared/qualified in
examinations like UGC-CSIR-NET, UGC-NET,
ATE/CAT/GRE/TOEFL/GMAT/ Central/State services, Defence, Civil Servants,
etc.
At least 20% of the students attempt competitive examinations. Generally, it is
observed that the academically motivated do work towards achieving these
qualifications, with the top 10 students of each class attempting these tests. Data is not
available on some of these achievements as students appear for these exams after
completing their course in College. Some departments have been able to track these
numbers and these are presented in the Department profile.
159