Page 311 - ssr_16
P. 311

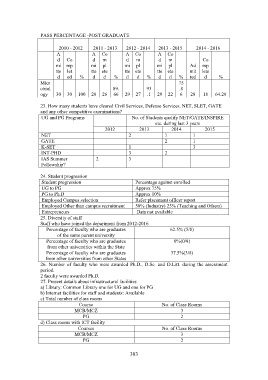
PASS PERCENTAGE -POST GRADUATE

                           2010 - 2012    2011 - 2013    2012 - 2014   2013 - 2015      2014 - 2016
                          A               A   Co         A   Co        A   Co
                          d    Co         d    m         d    m        d    m              Co
                          mi   mp         mi   pl       mi    pl       mi   pl       Ad    mp
                          tte  let        tte  ete       tte  ete      tte  ete      mit   lete
                          d    ed   %     d    d    %    d    d   %    d    d    %   ted    d     %
                   Micr                                                         75
                   obiol                           89.            93             .8
                   ogy    30  30  100  29  26      66    29  27   .1   29  22    6    28   18    64.29

                   23. How many students have cleared Civil Services, Defense Services, NET, SLET, GATE
                   and any other competitive examinations?
                   UG and PG Programs                       No. of Students qualify NET/GATE/INSPIRE
                                                                      etc. during last 3 years
                                                2012           2013          2014           2015
                   NET                                    2               1            1
                   GATE                                                   2            1
                   K-SET                                  1                            3
                   INT-PHD                                3               2
                   IAS Summer               2             3
                   Fellowship?

                   24. Student progression
                   Student progression                       Percentage against enrolled
                   UG to PG                                  Approx 75%
                   PG to Ph.D                                Approx 10%
                   Employed Campus selection                 Refer placement officer report
                   Employed Other than campus recruitment    50% (Industry) 25% (Teaching and Others)
                   Entrepreneurs                              Data not available
                   25. Diversity of staff
                   Staff who have joined the department from 2012-2016
                      Percentage of faculty who are graduates                62.5% (5/8)
                          of the same parent university
                      Percentage of faculty who are graduates                 0%(0/8)
                      from other universities within the State
                      Percentage of faculty who are graduates                37.5%(3/8)
                     from other universities from other States
                   26.  Number  of  faculty  who  were  awarded  Ph.D.,  D.Sc.  and  D.Litt.  during  the  assessment
                   period.
                   2 faculty were awarded Ph.D.
                   27. Present details about infrastructural facilities
                   a) Library: Common Library one for UG and one for PG
                   b) Internet facilities for staff and students: Available
                   c) Total number of class rooms
                                    Course                               No. of Class Rooms
                                  MCB/MCZ                                        3
                                      PG                                         2
                   d) Class rooms with ICT facility
                                    Courses                              No. of Class Rooms
                                  MCB/MCZ                                        3
                                      PG                                         2


                                                           303
   306   307   308   309   310   311   312   313   314   315   316