
Page 121 - Health, Population and Environment Education 9
P. 121
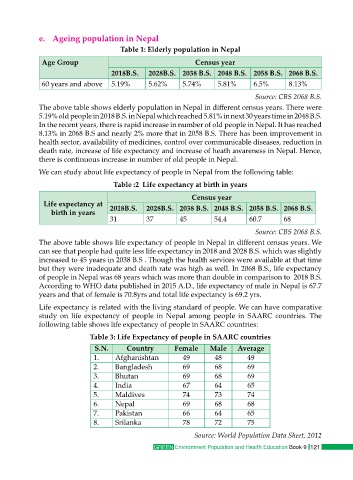
e.  Ageing population in Nepal
                                    Table 1: Elderly population in Nepal
             Age Group                                    Census year
                                 2018B.S.   2028B.S. 2038 B.S. 2048 B.S. 2058 B.S. 2068 B.S.
             60 years and above  5.19%      5.62%     5.74%     5.81%      6.5%      8.13%

                                                                           Source: CBS 2068 B.S.
            The above table shows elderly population in Nepal in different census years. There were
            5.19% old people in 2018 B.S. in Nepal which reached 5.81% in next 30 years time in 2048 B.S.
            In the recent years, there is rapid increase in number of old people in Nepal. It has reached
            8.13% in 2068 B.S and nearly 2% more that in 2058 B.S. There has been improvement in
            health sector, availability of medicines, control over communicable diseases, reduction in
            death rate, increase of life expectancy and increase of heath awareness in Nepal. Hence,
            there is continuous increase in number of old people in Nepal.
            We can study about life expectancy of people in Nepal from the following table:
                                  Table :2  Life expectancy at birth in years

                                                         Census year
              Life expectancy at   2018B.S.  2028B.S. 2038 B.S. 2048 B.S. 2058 B.S. 2068 B.S.
                birth in years
                                 31         37       45        54.4      60.7      68
                                                                           Source: CBS 2068 B.S.
            The above table shows life expectancy of people in Nepal in different census years. We
            can see that people had quite less life expectancy in 2018 and 2028 B.S. which was slightly
            increased to 45 years in 2038 B.S . Though the health services were available at that time
            but they were inadequate and death rate was high as well. In 2068 B.S., life expectancy
            of people in Nepal was 68 years which was more than double in comparison to  2018 B.S.
            According to WHO data published in 2015 A.D., life expectancy of male in Nepal is 67.7
            years and that of female is 70.8yrs and total life expectancy is 69.2 yrs.

            Life expectancy is related with the living standard of people. We can have comparative
            study on life expectancy of people in Nepal among people in SAARC  countries. The
            following table shows life expectancy of people in SAARC countries:
                           Table 3: Life Expectancy of people in SAARC countries
                             S.N.     Country       Female    Male    Average
                            1.    Afghanishtan        49       48        49
                            2.    Bangladesh          69       68        69
                            3.    Bhutan              69       68        69
                            4.    India               67       64        65
                            5.    Maldives            74       73        74
                            6.    Nepal               69       68        68
                            7.    Pakistan            66       64        65
                            8.    Srilanka            78       72        75
                                                         Source: World Population Data Sheet, 2012
                                              GREEN  Environment Population and Health Education Book-9 121