
Page 143 - ENGLISH 8
P. 143
UNIT: FOURTEEN
G Graphs and Charts
1. Reading
A. Engage yourself
1. There are many ways of presenting information. Data is presented in graphs and
charts. Have you seen such graphs and charts? Where do you find it? Share it
with your friends.
2. Work in groups. Discuss why we present data in such diagrams.
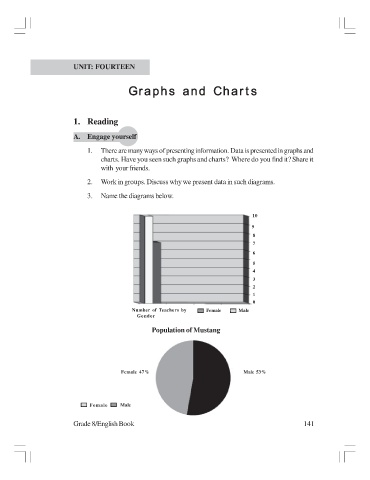
3. Name the diagrams below.
10
9
8
7
6
5
4
3
2
1
0
Number of Teachers by Female Male
Gender
Population of Mustang
Female 47% Male 53%
Female Male
Grade 8/English Book 141