
Page 146 - ENGLISH 8
P. 146
(d) In a period of four decades the population increased by 3,343,081.
(e) The number of people who passed the primary level constituted 43 percentage
of the total population.
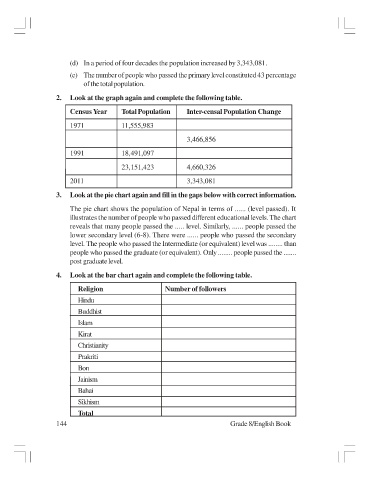
2. Look at the graph again and complete the following table.
Census Year Total Population Inter-censal Population Change
1971 11,555,983
3,466,856
1991 18,491,097
23,151,423 4,660,326
2011 3,343,081
3. Look at the pie chart again and fill in the gaps below with correct information.
The pie chart shows the population of Nepal in terms of ...... (level passed). It
illustrates the number of people who passed different educational levels. The chart
reveals that many people passed the ..... level. Similarly, ...... people passed the
lower secondary level (6-8). There were ...... people who passed the secondary
level. The people who passed the Intermediate (or equivalent) level was ........ than
people who passed the graduate (or equivalent). Only ........ people passed the .......
post graduate level.
4. Look at the bar chart again and complete the following table.
Religion Number of followers
Hindu
Buddhist
Islam
Kirat
Christianity
Prakriti
Bon
Jainism
Bahai
Sikhism
Total
144 Grade 8/English Book