
Page 212 - ENGLISH 10
P. 212
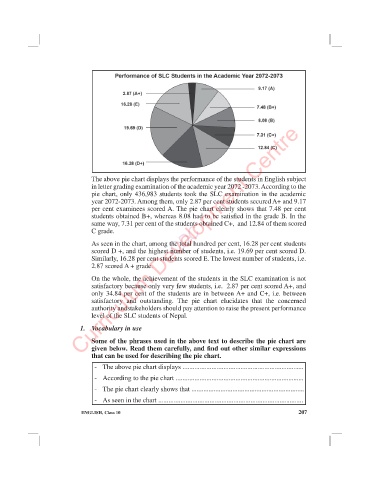
The above pie chart displays the performance of the students in English subject
                               in letter grading examination of the academic year 2072 -2073. According to the
                               pie chart, only 436,983 students took the SLC examination in the academic
                               year 2072-2073. Among them, only 2.87 per cent students secured A+ and 9.17
                               per cent examinees scored A. The pie chart clearly shows that 7.48 per cent

                               students obtained B+, whereas 8.08 had to be satis¿ed in the grade B. In the
                               same way, 7.31 per cent of the students obtained C+,  and 12.84 of them scored
                                                           CDC
                               C grade.
                              Curriculum Development Centre
                               As seen in the chart, among the total hundred per cent, 16.28 per cent students
                               scored D +, and the highest number of students, i.e. 19.69 per cent scored D.
                               Similarly, 16.28 per cent students scored E. The lowest number of students, i.e.
                               2.87 scored A + grade.

                               On the whole, the achievement of the students in the SLC examination is not
                               satisfactory because only very few students, i.e.  2.87 per cent scored A+, and
                               only 34.84 per cent of the students are in between A+ and C+, i.e. between
                               satisfactory and outstanding.  The pie chart elucidates that the concerned
                               authority andstakeholders should pay attention to raise the present performance
                               level of the SLC students of Nepal.

                            1.   Vocabulary in use

                               Some of the phrases used in the above text to describe the pie chart are

                               given below. Read them carefully, and ¿nd out other similar expressions
                               that can be used for describing the pie chart.
                                -  The above pie chart displays .......................................................................
                                -  According to the pie chart ...........................................................................
                                -  The pie chart clearly shows that ..................................................................

                                -  As seen in the chart .....................................................................................
                            ENGLISH, Class 10                                                       207