
Page 209 - ENGLISH 10
P. 209
e. potato serving having
sorting frying
washing chopping
Curriculum Development Centre
……………………………
2. Look at the ¿gure 'e', and tell your friends what it is about.
B. Study time
Reading I
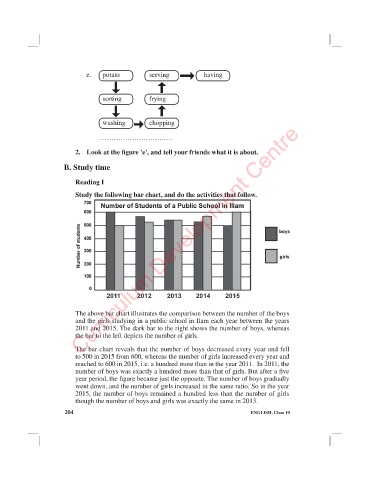
Study the following bar chart, and do the activities that follow.
CDC
The above bar chart illustrates the comparison between the number of the boys
and the girls studying in a public school in Ilam each year between the years
2011 and 2015. The dark bar to the right shows the number of boys, whereas
the bar to the left depicts the number of girls.
The bar chart reveals that the number of boys decreased every year and fell
to 500 in 2015 from 600, whereas the number of girls increased every year and
reached to 600 in 2015, i.e. a hundred more than in the year 2011. In 2011, the
number of boys was exactly a hundred more than that of girls. But after a ¿ ve
year period, the ¿gure became just the opposite. The number of boys gradually
went down, and the number of girls increased in the same ratio. So in the year
2015, the number of boys remained a hundred less than the number of girls
though the number of boys and girls was exactly the same in 2013.
204 ENGLISH, Class 10