
Page 155 - ANUAL REPORT MOH 2017
P. 155
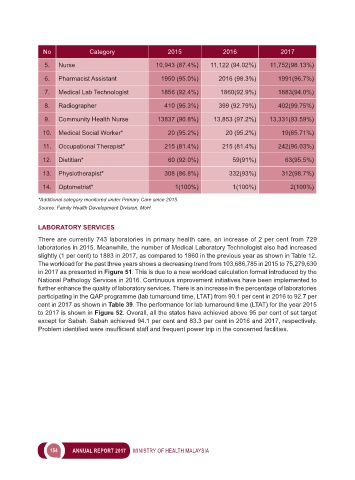
No             Category                 2015             2016               2017
               5.   Nurse                          10,943 (87.4%)   11,122 (94.02%)    11,752(98.13%)

               6.   Pharmacist Assistant            1950 (95.0%)       2016 (98.3%)       1991(96.7%)

               7.   Medical Lab Technologist        1856 (92.4%)       1860(92.9%)        1883(94.0%)
               8.   Radiographer                      410 (95.3%)      399 (92.79%)       402(99.75%)

               9.   Community Health Nurse         13837 (90.8%)     13,853 (97.2%)    13,331(93.59%)

               10.  Medical Social Worker*             20 (95.2%)        20 (95.2%)        19(85.71%)
               11.  Occupational Therapist*           215 (81.4%)       215 (81.4%)       242(96.03%)

               12.  Dietitian*                         60 (92.0%)          59(91%)          63(95.5%)

               13.  Physiotherapist*                  308 (86.8%)         332(93%)         312(98.7%)
               14.  Optometrist*                         1(100%)           1(100%)            2(100%)

             *Additional category monitored under Primary Care since 2015.
             Source: Family Health Development Division, MoH

             LABORATORY SERVICES

             There are currently 743 laboratories in primary health care, an increase of 2 per cent from 729
             laboratories in 2015. Meanwhile, the number of Medical Laboratory Technologist also had increased
             slightly (1 per cent) to 1883 in 2017, as compared to 1860 in the previous year as shown in Table 12.
             The workload for the past three years shows a decreasing trend from 103,686,785 in 2015 to 75,279,630
             in 2017 as presented in Figure 51. This is due to a new workload calculation format introduced by the
             National Pathology Services in 2016. Continuous improvement initiatives have been implemented to
             further enhance the quality of laboratory services. There is an increase in the percentage of laboratories
             participating in the QAP programme (lab turnaround time, LTAT) from 90.1 per cent in 2016 to 92.7 per
             cent in 2017 as shown in Table 39. The performance for lab turnaround time (LTAT) for the year 2015
             to 2017 is shown in Figure 52. Overall, all the states have achieved above 95 per cent of set target
             except for Sabah. Sabah achieved 94.1 per cent and 83.3 per cent in 2016 and 2017, respectively.
             Problem identified were insufficient staff and frequent power trip in the concerned facilities.


                 154    ANNUAL REPORT 2017     MINISTRY OF HEALTH MALAYSIA