
Page 286 - ANUAL REPORT MOH 2017
P. 286
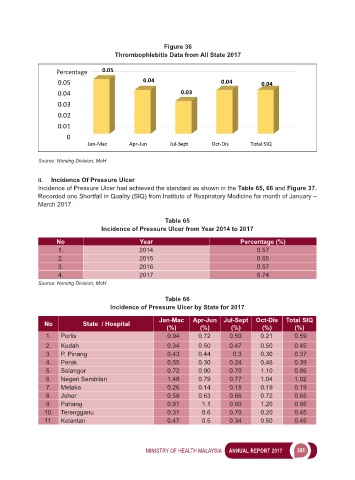
Figure 36
                                      Thrombophlebitis Data from All State 2017

                   Percentage     0.05
                    0.05                       0.04                     0.04         0.04

                    0.04                                   0.03
                    0.03
                    0.02
                    0.01
                      0
                             Jan-Mac      Apr-Jun      Jul-Sept      Oct-Dis     Total SIQ

             Source: Nursing Division, MoH


             ii.   Incidence Of Pressure Ulcer
             Incidence of Pressure Ulcer had achieved the standard as shown in the Table 65, 66 and Figure 37.
             Recorded one Shortfall in Quality (SIQ) from Institute of Respiratory Medicine for month of January –
             March 2017.

                                                      Table 65
                                 Incidence of Pressure Ulcer from Year 2014 to 2017
                   No                         Year                            Percentage (%)
                    1.                        2014                                 0.57
                    2.                        2015                                 0.65
                    3.                        2016                                 0.57
                    4.                        2017                                 0.74
             Source: Nursing Division, MoH

                                                      Table 66
                                    Incidence of Pressure Ulcer by State for 2017

                                                    Jan-Mac    Apr-Jun  Jul-Sept  Oct-Dis  Total SIQ
               No          State  / Hospital
                                                      (%)        (%)       (%)       (%)       (%)
                1.  Perlis                            0.94      0.72      0.50      0.21       0.59
                2.  Kedah                             0.34      0.50      0.47      0.50       0.45
                3.  P. Pinang                         0.43      0.44       0.3      0.30       0.37
                4.  Perak                             0.55      0.30      0.24      0.46       0.39
                5.  Selangor                          0.72      0.90      0.70      1.10       0.86
                6.  Negeri Sembilan                   1.48      0.79      0.77      1.04       1.02
                7.  Melaka                            0.26      0.14      0.18      0.19       0.19
                8.  Johor                             0.58      0.63      0.66      0.72       0.65
                9.  Pahang                            0.91        1.1     0.60      1.20       0.95
               10.  Terengganu                        0.31        0.6     0.70      0.20       0.45
               11.  Kelantan                          0.47        0.5     0.34      0.50       0.45


                                                MINISTRY OF HEALTH MALAYSIA     ANNUAL REPORT 2017       285