
Page 285 - ANUAL REPORT MOH 2017
P. 285
i. Incidence of Thrombophlebitis
ii. Incidence of Pressure Ulcer
iii. To Reduce Patient Fall.
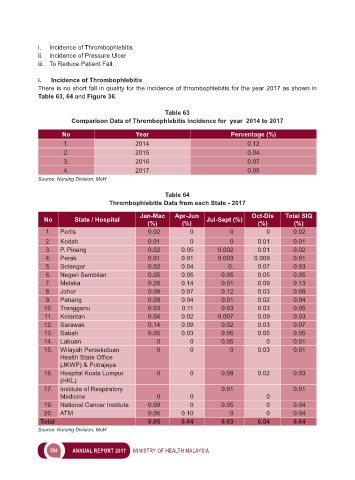
i. Incidence of Thrombophlebitis
There is no short fall in quality for the incidence of thrombophlebitis for the year 2017 as shown in
Table 63, 64 and Figure 36.
Table 63
Comparison Data of Thrombophlebitis Incidence for year 2014 to 2017
No Year Percentage (%)
1. 2014 0.12
2. 2015 0.04
3. 2016 0.07
4. 2017 0.05
Source: Nursing Division, MoH
Table 64
Thrombophlebitis Data from each State - 2017
Jan-Mac Apr-Jun Oct-Dis Total SIQ
No State / Hospital Jul-Sept (%)
(%) (%) (%) (%)
1. Perlis 0.02 0 0 0 0.02
2. Kedah 0.01 0 0 0.01 0.01
3. P. Pinang 0.02 0.05 0.002 0.01 0.02
4. Perak 0.01 0.01 0.003 0.009 0.01
5. Selangor 0.02 0.04 0. 0.07 0.03
6. Negeri Sembilan 0.05 0.05 0.05 0.05 0.05
7. Melaka 0.26 0.14 0.01 0.09 0.13
8. Johor 0.08 0.07 0.12 0.03 0.08
9. Pahang 0.09 0.04 0.01 0.02 0.04
10. Trengganu 0.03 0.11 0.03 0.03 0.05
11. Kelantan 0.04 0.02 0.007 0.09 0.03
12. Sarawak 0.14 0.09 0.02 0.03 0.07
13. Sabah 0.05 0.03 0.06 0.05 0.05
14. Labuan 0 0 0.05 0 0.01
15. Wilayah Persekutuan 0 0 0 0.03 0.01
Health State Office
(JKWP) & Putrajaya
16. Hospital Kuala Lumpur 0 0 0.08 0.02 0.03
(HKL)
17. Institute of Respiratory 0.01 0.01
Medicine 0 0 0
19. National Cancer Institute 0.09 0 0.05 0 0.04
20. ATM 0.06 0.10 0 0 0.04
Total 0.05 0.04 0.03 0.04 0.04
Source: Nursing Division, MoH
284 ANNUAL REPORT 2017 MINISTRY OF HEALTH MALAYSIA