
Page 126 - The Atlas of Economic Complexity
P. 126
MAPPING PATHS TO PROSPERITY | 127
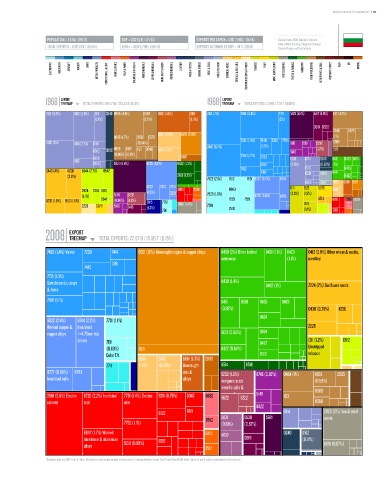
POPULATION ≥ 7.6 M / (79/12) GDP ≥ USD 52 b / (71/13) EXPORTS PER CAPITA ≥ USD 2,965 / (51/14) * Data are from 2008. Numbers indicate:
value (World Ranking / Regional Ranking).
TOTAL EXPORTS ≥ USD 23 b / (65/14) GDPpc ≥ USD 6,798 / (58/14) EXPORTS AS SHARE OF GDP ≥ 44 % (38/11) Eastern Europe and Central Asia.
ELECTRONICS MACHINERY AIRCRAFT bOILERS SHIPS METAL PRODUCTS CONSTR. MATL. & EqPT. HOME & OFFICE PULP & PAPER CHEMICALS & HEALTH AGROCHEMICALS OTHER CHEMICALS INOR. SALTS & ACIDS PETROCHEMICALS LEATHER MILK & CHEESE ANIMAL FIbERS MEAT & EGGS FISH & SEAFOOD TROPICAL AGRIC. CEREALS & vEG. OILS COTTON/RICE/SOY & OTHERS TObACCO FRUIT MISC. AGRICULTURE NOT CLASSIFIED TEXTILE & FAbRICS GARMENTS FOOD PROCESSING bEER/SPIRITS & CIGS. PRECIOUS STONES COAL OIL MINING
EXPORT EXPORT
1968 TREEMAP TOTAL EXPORTS: 298.17 M / 228.33 b (0.13%) 1988 TREEMAP TOTAL EXPORTS: 2.29 b / 2.79 T (0.08%)
Total Exports: 298.17 M / 228.33 B (0.13%) Total Exports: 2.29 B / 2.79 T (0.08%)
0011 (5.2%) 0113 (3.9%) 0111 0240 0565 (4.4%) 0589 6861 (4.1%) 6811 7441 (7%) 7841 (6.4%) 7721 5621 (4.1%) 5417 (1.6%) 1121 (3.2%)
(2.1%) (2.2%) (1.5%) (2%)
0819 5530
0545 0579
6851 (2.3%) 6821 (2.9%)
0545 (1.7%) 0583 0579 (1%)
0012 (5%) 0114 (2.1%) 0118 (0.84%) 7442 (6.7%) 7361 (1.9%) 7449 7224 7784 5112 2331 5232 0565
(1.2%)
0913 0230 0585 0561 1121 0546 6841 (1.8%) 5148 (1.2%) 5121
(0.96%) (0.9%) 7188 (1.7%)
0015 6612 7783 0012 0011 0240 8421 8435 8431
0112
0013 5621 (6.4%) 6725 (4.5%) 6522 (1.3%) 6991 (2.8%) (0.87%) (1%)
0440 (4%) 4236 0544 (2.7%) 0542 7452 7367 0118 0360 8441 8459
0251
(2.8%) 2613 (1.2%) 8462
7522 (2.1%) 7512 7591 6727 (2.7%) 6744
0616 0342 2882 6861 6821
6727 6712 6716 1211 1223 0575
2924 0751 0615 (1.3%) 5224 2483 2519 8983 (2.3%) (1.5%) 6851
(1.1%) 5148 5232 7528 (1.6%) 6725 (2.6%) 6749 5513
4232 (1.8%) 5513 (1.6%) 0541 (0.98%) (1.3%) 7915 7781 7525 7521 1222 8219 8998 2820
2223 0575 5169 5413 (1.2%) 2665 (1.4%) 7781 7518
7511 (1.1%) 3510
EXPORT
2008 TREEMAP TOTAL EXPORTS: 22.57 b / 15.56 T (0.15%)
Total Exports: 22.57 B / 15.56 T (0.15%)
7492 (1.4%) Valves 7239 7441 6821 (12%) Unwrought copper & copper alloys 8459 (2%) Other knitted 8431 (1.1%) 8423 0412 (2.8%) Other wheat & meslin,
outerwear (1.1%) unmilled
7361
7442
7721 (1.3%)
Switchboards, relays 8439 (1.4%) 8462 (1%) 2224 (2%) Sunflower seeds
& fuses
7188 (1.1%) 8451 8510 8435 8463
(0.92%) 0430 (0.78%) 4236
8424
6822 (2.4%) 6744 (2.2%) 7781 (1.1%)
Worked copper & Iron/steel 2226
copper alloys >=4.75mm tick 6123 (0.65%) 8434
sheets 7611 8472 1211 (1.2%) 0612
(0.83%) 2871 8422 (0.64%) Unstripped
Color T.V. 8310 tobacco
6851 2882 6861 (1.3%) 2890
7711 (1.1%) (0.59%) Unwrought 6514 6516
6727 (0.98%) 6783 zinc & 5232 (1.3%) 8745 (0.82%) 0484 (1%) 8931 0565
Iron/steel coils alloys Inorganic acids (0.56%)
metallic salts & 0589
3510 (3.6%) Electric 6732 (2.2%) Iron/steel 7731 (1.4%) Electric 8211 (0.75%) 6343 6652 peroxysalts 5222 5148 1121
5622
current rods wire 0586
8822
8122 6911 0114 2820 (2%) Iron & steel
7852 5831 5530 5621 waste
7752 (1.1%) (0.61%) (0.67%)
6842 (1.7%) Worked 6413 5832 0240 6512
aluminium & aluminium 8212 0819 (0.71%)
alloys 8219 (0.88%) 2517 6651 (0.67%)
* Numbers indicate SITC-4 rev 2 codes. Parenthesis indicate percentage of total exports. Treemap Headers show: Total Trade/Total World Trade (share of world trade represented by the country).