
Page 124 - The Atlas of Economic Complexity
P. 124
MAPPING PATHS TO PROSPERITY | 125
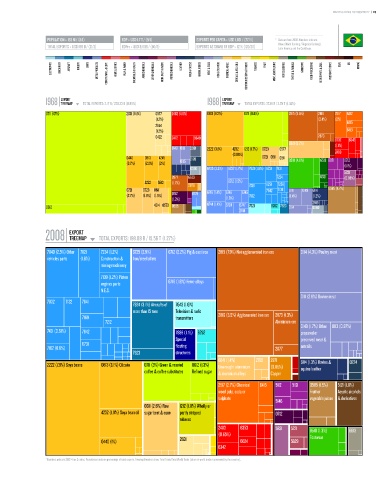
POPULATION ≥ 192 M / (5/1) GDP ≥ USD 1.7 T / (9/1) EXPORTS PER CAPITA ≥ USD 1,031 / (77/11) * Data are from 2008. Numbers indicate:
value (World Ranking / Regional Ranking).
TOTAL EXPORTS ≥ USD 198 b / (21/2) GDPpc ≥ USD 8,609 / (50/6) EXPORTS AS SHARE OF GDP ≥ 12 % (120/20) Latin America and the Caribbean.
ELECTRONICS MACHINERY AIRCRAFT bOILERS SHIPS METAL PRODUCTS CONSTR. MATL. & EqPT. HOME & OFFICE PULP & PAPER CHEMICALS & HEALTH AGROCHEMICALS OTHER CHEMICALS INOR. SALTS & ACIDS PETROCHEMICALS LEATHER MILK & CHEESE ANIMAL FIbERS MEAT & EGGS FISH & SEAFOOD TROPICAL AGRIC. CEREALS & vEG. OILS COTTON/RICE/SOY & OTHERS TObACCO FRUIT MISC. AGRICULTURE NOT CLASSIFIED TEXTILE & FAbRICS GARMENTS FOOD PROCESSING bEER/SPIRITS & CIGS. PRECIOUS STONES COAL OIL MINING
EXPORT EXPORT
1968 TREEMAP TOTAL EXPORTS: 2.17 b / 228.33 b (0.95%) 1988 TREEMAP TOTAL EXPORTS: 37.39 b / 2.79 T (1.34%)
Total Exports: 2.17 B / 228.33 B (0.95%) Total Exports: 37.39 B / 2.79 T (1.34%)
0711 (47%) 2631 (8.1%) 0577 2482 (4.6%) 0813 (8.2%) 0711 (8.6%) 2815 (5.5%) 2816 2517 6412
(1.2%) (2.4%) (2%) 6415
2654
(1.2%) 6413
0422 2472 6649 2873 6732 6342
6841 (3.7%) (1.1%)
0149 0111 2681 2222 (3.1%) 4232 1212 (1.7%) 0723 0577
(0.88%) 2483
0440 0813 4245 2120 0721 0611 0811 8510 (4.8%) 6513 6871 0712
(3.7%) (2.2%) (2%) 0115 (1.1%)
0360 6725 (3.2%) 6727 (1.7%) 7821 (1.9%) 6731 7431
5831
2877 6673 7224 6521 (0.88%)
2222 5513 (1.7%) 6712 (1.5%)
2879 7139 6251 7259
0721 0723 0611 6716 (1.4%) 6746 6745 7842 7138 0111 0149 6114 0585 (4.7%)
(2.7%) (1.8%) (1.5%) 0712 6725 7132 (1.4%) (1.2%)
(1.3%) (1.3%) 2919
0612 4314 0573 0585 6744 (1.4%) 6724 6747 7621 6252 7923 0114 0360
2814
EXPORT
2008 TREEMAP TOTAL EXPORTS: 198.08 b / 15.56 T (1.27%)
Total Exports: 198.08 B / 15.56 T (1.27%)
7849 (2.5%) Other 7821 7234 (1.2%) 6725 (2.9%) 6712 (2.2%) Pig & cast iron 2815 (7.9%) Not agglomerated iron ore 0114 (4.3%) Poultry meat
vehicles parts (1.6%) Construction & Iron/steel billets
mining machinery
7139 (1.2%) Piston
engines parts 6716 (1.6%) Ferro-alloys
N.E.S.
0111 (2.9%) Bovine meat
7832 7132 7841
7924 (3.1%) Aircrafts of 7643 (1.6%)
more than 15 tons Television & radio
7169 transmitters 2816 (3.9%) Agglomerated iron ore 2873 (1.3%)
7212 Aluminium ore
0149 (1.7%) Other 0113 (0.97%)
7431 (0.61%) 7842 7938 (1.1%) 6252 prepared or
Special preserved meat &
6731
7162 (0.6%) floating 2877 entrails
7923 structures
6841 (1.4%) 2782 2871 6114 (1.3%) Bovine & 0224
2222 (7.8%) Soya beans 0813 (3.1%) Oilcake 0711 (3%) Green & roasted 0612 (1.3%) Unwrought aluminium (0.85%)
coffee & coffee substitutes Refined sugar & aluminium alloys Copper equine leather
2517 (2.7%) Chemical 6415 5112 5161 0585 (1.5%) 5121 (1.8%)
wood pulp, soda or Fruit or Acyclic alcohols
sulphate vegetable juices & derivatives
5146
0611 (2.6%) Raw 1212 (1.8%) Wholly or
4232 (1.9%) Soya bean oil sugar beet & cane partly stripped 0712
tobacco
2483 6353 5831 5221 8510 (1.3%) 6613
(0.65%)
2631 Footwear
0440 (1%) 6624 5629
6342
* Numbers indicate SITC-4 rev 2 codes. Parenthesis indicate percentage of total exports. Treemap Headers show: Total Trade/Total World Trade (share of world trade represented by the country).