
Page 136 - The Atlas of Economic Complexity
P. 136
MAPPING PATHS TO PROSPERITY | 137
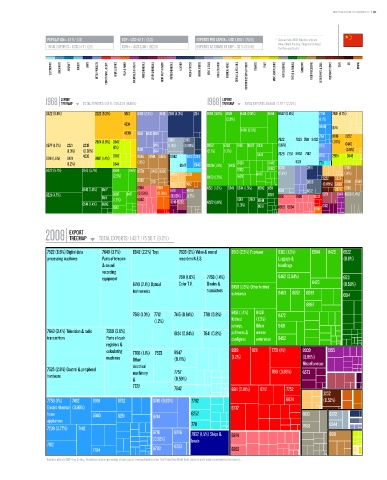
POPULATION ≥ 1.3 b / (1/1) GDP ≥ USD 4.5 T / (3/2) EXPORTS PER CAPITA ≥ USD 1,080 / (76/9) * Data are from 2008. Numbers indicate:
value (World Ranking / Regional Ranking).
TOTAL EXPORTS ≥ USD 1.4 T / (2/1) GDPpc ≥ USD 3,414 / (82/9) EXPORTS AS SHARE OF GDP ≥ 32 % (63/10) East Asia and Pacific.
ELECTRONICS MACHINERY AIRCRAFT bOILERS SHIPS METAL PRODUCTS CONSTR. MATL. & EqPT. HOME & OFFICE PULP & PAPER CHEMICALS & HEALTH AGROCHEMICALS OTHER CHEMICALS INOR. SALTS & ACIDS PETROCHEMICALS LEATHER MILK & CHEESE ANIMAL FIbERS MEAT & EGGS FISH & SEAFOOD TROPICAL AGRIC. CEREALS & vEG. OILS COTTON/RICE/SOY & OTHERS TObACCO FRUIT MISC. AGRICULTURE NOT CLASSIFIED TEXTILE & FAbRICS GARMENTS FOOD PROCESSING bEER/SPIRITS & CIGS. PRECIOUS STONES COAL OIL MINING
EXPORT EXPORT
1968 TREEMAP TOTAL EXPORTS: 1.57 b / 228.33 b (0.69%) 1988 TREEMAP TOTAL EXPORTS: 61.94 b / 2.79 T (2.22%)
Total Exports: 1.57 B / 228.33 B (0.69%) Total Exports: 61.94 B / 2.79 T (2.22%)
0422 (9.8%) 2222 (5.2%) 5513 0013 (2.9%) 0113 2919 (4.3%) 2114 8310 (3.8%) 8510 8451 (2.8%) 6584 8942 (6.6%) 7758 2631 (1.7%)
(2.9%) (1.1%)
4234 6940
8439 (2.6%) 0741
4239 0149 6130 0118 7161 0813 2222
2924 (1.8%) 0542 0360 2683 7622 7638 7611 8482 (1.6%)
0577 (1.7%) 2221 2235 (1%) 0116 (1.3%) (0.99%) 8459 8462 8481 8997 8431 (1.6%) 6716 0440
(1.3%) (0.82%) 0014 0114 (2.1%) (1.7%) 7628 7757 8852 7512 (0.8%)
4233 0752 0545 0561 0565 8942 6991 7243 8441 6712 2924 0548
0741 (1.6%) 0421 0612 (1.4%)
(1.2%) 0541 (1.1%) 8947 6940 8429 (1.6%) 8435 8424 8442 8124 7711
6522 (5.7%) 2613 (3.7%) 6584 8472 0579 0483 0980 6552 8463 0360 2919 0565
(2.5%) 2783 2879 8423 (1.5%) 8421 8472 (2.3%) 3222 5225 (1.1%)
0589 0121 6612 2683 (0.89%) 6899 0546 0545
6513 (1.8%) 6517 6664 5981 2789 8999 6521 (1.9%) 6541 6534 (1.5%) 6592 6511 0341 6512 2879 0589
6871
6521 (4.7%) 8997 8471 (0.99%) (0.91%) (0.93%) (1.7%) 6516 5221 6871 8999 (1.4%)
6511 8851 8994 8212
(1.2%) 8952 6513 2613 6544
6541 (1.4%) 6592 0819 5232 6522 (1.8%) (1.3%) 5413
8510 6519 6953 6664 5981
EXPORT
2008 TREEMAP TOTAL EXPORTS: 1.43 T / 15.56 T (9.2%)
Total Exports: 1.43 T / 15.56 T (9.2%)
7522 (6.6%) Digital data 7649 (3.7%) 8942 (2.3%) Toys 7638 (2%) Video & sound 8510 (2.5%) Footwear 8310 (1.3%) 6584 8429 6522
processing machines Parts of telecom recorders N.E.S. Luggage & (0.8%)
& sound handbags
recording
equipment 7611 (1.6%) 7763 (1.4%) 8462 (0.84%) 6531
8710 (2.1%) Optical Color T.V. Diodes & 8459 (1.8%) Other knitted 8423 (0.56%)
instruments transistors
outerwear 8463 6552 6589 6514
8997
7518 (1.3%) 7712 7415 (0.84%) 7781 (0.8%) 8451 (1.4%) 8439 8472
(1.2%) Knitted (1.3%)
jerseys, Other 8431
7643 (3.4%) Television & radio 7599 (2.8%) 8124 (0.84%) 7641 (0.8%) pullovers & women
transmitters Parts of cash cardigans outerwear 8452
registers &
calculating 7788 (1.1%) 7523 8947 8219 8211 7731 (1%) 8939 5155
machines Other (0.71%) (1.2%) (0.85%)
electrical Miscellaneous
7525 (2.8%) Control & peripheral machinery 7757 7861 (0.83%) articles of
6573
hardware plastic
& (0.59%)
7722
equipment 7642 6911 (0.81%) 8212 7752
N.E.S. 3232
7758 (1%) 7492 6991 6782 6749 (0.63%) 7782 6624 (0.52%)
Electro-thermal (0.86%) 6732
home 6940 6251 6744 6252 6613 0372
appliances
N.E.S. 7442 7711 7853 0344
7239 (0.77%)
6716 6746 7932 (1.5%) Ships & 6974 8931
(0.52%) boats
7162 6733
7784 6783 6953
* Numbers indicate SITC-4 rev 2 codes. Parenthesis indicate percentage of total exports. Treemap Headers show: Total Trade/Total World Trade (share of world trade represented by the country).