
Page 138 - The Atlas of Economic Complexity
P. 138
MAPPING PATHS TO PROSPERITY | 139
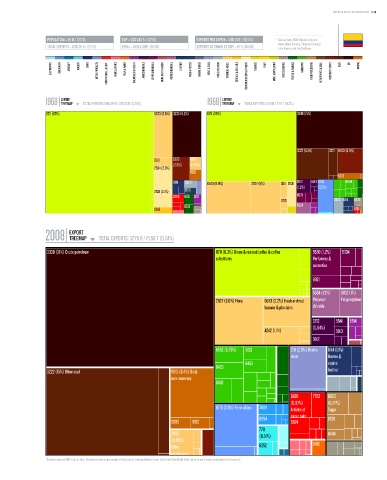
POPULATION ≥ 45 M / (27/3) GDP ≥ USD 243 b / (37/5) EXPORTS PER CAPITA ≥ USD 838 / (82/14) * Data are from 2008. Numbers indicate:
value (World Ranking / Regional Ranking).
TOTAL EXPORTS ≥ USD 38 b / (57/6) GDPpc ≥ USD 5,389 / (64/11) EXPORTS AS SHARE OF GDP ≥ 16 % (114/18) Latin America and the Caribbean.
ELECTRONICS MACHINERY AIRCRAFT bOILERS SHIPS METAL PRODUCTS CONSTR. MATL. & EqPT. HOME & OFFICE PULP & PAPER CHEMICALS & HEALTH AGROCHEMICALS OTHER CHEMICALS INOR. SALTS & ACIDS PETROCHEMICALS LEATHER MILK & CHEESE ANIMAL FIbERS MEAT & EGGS FISH & SEAFOOD TROPICAL AGRIC. CEREALS & vEG. OILS COTTON/RICE/SOY & OTHERS TObACCO FRUIT MISC. AGRICULTURE NOT CLASSIFIED TEXTILE & FAbRICS GARMENTS FOOD PROCESSING bEER/SPIRITS & CIGS. PRECIOUS STONES COAL OIL MINING
EXPORT EXPORT
1968 TREEMAP TOTAL EXPORTS: 596.39 M / 228.33 b (0.26%) 1988 TREEMAP TOTAL EXPORTS: 5.56 b / 2.79 T (0.2%)
Total Exports: 596.39 M / 228.33 B (0.26%) Total Exports: 5.56 B / 2.79 T (0.2%)
0711 (67%) 0573 (5.5%) 3330 (8.2%) 0711 (39%) 3330 (15%)
3222 (6.3%) 3221 6673 (3.9%)
0611 6673 6812
(2.5%) (0.91%)
2634 (2.8%)
6612
6612
2119 0360 0573 (8.9%) 2927 (6%) 0611 2631 0712 5913 6716 6584
2631 (2.1%) 2120 (1.2%) (3.3%)
2483 6521 2671 8921
0721 0360 6114 5833
6513 5834
0813
EXPORT
2008 TREEMAP TOTAL EXPORTS: 37.70 b / 15.56 T (0.24%)
Total Exports: 37.70 B / 15.56 T (0.24%)
3330 (31%) Crude petroleum 0711 (6.3%) Green & roasted coffee & coffee 5530 (1.2%) 5334
substitutes Perfumery &
cosmetics
8921
5834 (1.2%) 5832 (1%)
2927 (3.6%) Flora 0573 (2.2%) Fresh or dried Polyvinyl Polypropylene
banana & plantains chloride
0712 5541 5514
(0.64%)
4242 (1.1%) 5913
5912
6552 (0.78%) 6123 0111 (2.5%) Bovine 6114 (1.1%)
meat Bovine &
8465 equine
8423
3222 (15%) Other coal 9710 (3.4%) Gold, leather
non-monetary
8462
6428 7752 0620
(0.87%) (0.77%)
6716 (2.8%) Ferro-alloys 7499 Articles of Sugar
6954 paper pulp confectionary
8931
2890 6612 6624 (not
N.E.S.
7711 chocolate)
2882 (0.51%) 0484
(0.96%)
Other 6252 6415
non-ferrous
* Numbers indicate SITC-4 rev 2 codes. Parenthesis indicate percentage of total exports. Treemap Headers show: Total Trade/Total World Trade (share of world trade represented by the country).