
Page 144 - The Atlas of Economic Complexity
P. 144
MAPPING PATHS TO PROSPERITY | 145
POPULATION ≥ 21 M / (47/10) GDP ≥ USD 23 b / (91/9) EXPORTS PER CAPITA ≥ USD 479 / (97/10) * Data are from 2008. Numbers indicate:
value (World Ranking / Regional Ranking).
TOTAL EXPORTS ≥ USD 9.9 b / (77/5) GDPpc ≥ USD 1,137 / (105/13) EXPORTS AS SHARE OF GDP ≥ 42 % (41/8) Sub-Saharan Africa.
ELECTRONICS MACHINERY AIRCRAFT bOILERS SHIPS METAL PRODUCTS CONSTR. MATL. & EqPT. HOME & OFFICE PULP & PAPER CHEMICALS & HEALTH AGROCHEMICALS OTHER CHEMICALS INOR. SALTS & ACIDS PETROCHEMICALS LEATHER MILK & CHEESE ANIMAL FIbERS MEAT & EGGS FISH & SEAFOOD TROPICAL AGRIC. CEREALS & vEG. OILS COTTON/RICE/SOY & OTHERS TObACCO FRUIT MISC. AGRICULTURE NOT CLASSIFIED TEXTILE & FAbRICS GARMENTS FOOD PROCESSING bEER/SPIRITS & CIGS. PRECIOUS STONES COAL OIL MINING
EXPORT EXPORT
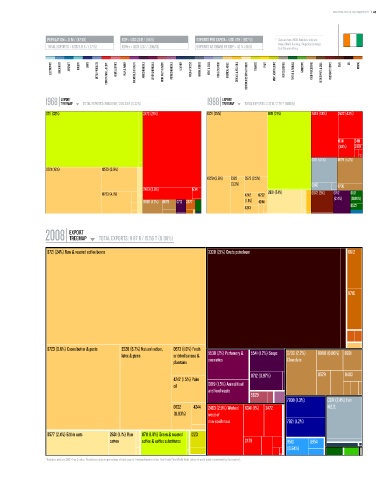
1968 TREEMAP TOTAL EXPORTS: 506.69 M / 228.33 b (0.22%) 1988 TREEMAP TOTAL EXPORTS: 2.37 b / 2.79 T (0.08%)
Total Exports: 506.69 M / 228.33 B (0.22%) Total Exports: 2.37 B / 2.79 T (0.08%)
0711 (32%) 2472 (28%) 0721 (25%) 0711 (21%) 2483 (7.8%) 2472 (4.2%)
6341 2481
(1.9%) 2479
0371 (4.1%) 0579 (4.2%)
0721 (16%) 0573 (5.5%)
0723 (5.6%) 2320 0573 (2.5%)
(3.3%) 0342
2483 (3.8%) 6341 0730
0723 (4.1%) 4242 0722 2631 (5.1%) 6672 (3%) 0712 6521
0589 (1.7%) 0579 0712 2877 (1.1%) 4244 (2.4%) (0.98%)
4243 6522
EXPORT
2008 TREEMAP TOTAL EXPORTS: 9.87 b / 15.56 T (0.06%)
Total Exports: 9.87 B / 15.56 T (0.06%)
0721 (24%) Raw & roasted coffee beans 3330 (21%) Crude petroleum 6612
9710
0723 (9.6%) Cocoa butter & paste 2320 (6.7%) Natural rubber, 0573 (1.6%) Fresh
latex & gums or dried banana & 5530 (2%) Perfumery & 5541 (1.2%) Soaps 0730 (2.2%) 0980 (0.86%) 8931
plantains cosmetics Chocolate
0712 (0.97%) 0579 0483
4242 (1.5%) Palm
oil 0819 (1.5%) Animal feed
and food waste
5629
7938 (1.3%) 0371 (2.4%) Fish
0722 4244 2483 (2.9%) Worked 6341 (1%) 2472 N.E.S.
(0.83%) wood of
non-coniferous 7921 (1.2%)
0577 (2.4%) Edible nuts 2631 (1.1%) Raw 0711 (1.8%) Green & roasted 1223
cotton coffee & coffee substitutes 2479 9510 6954
(0.64%)
* Numbers indicate SITC-4 rev 2 codes. Parenthesis indicate percentage of total exports. Treemap Headers show: Total Trade/Total World Trade (share of world trade represented by the country).