Page 148 - The Atlas of Economic Complexity
P. 148

MAPPING PATHS TO PROSPERITY  |  149


                   POPULATION ≥ 11 M / (65/10)  GDP ≥ USD 63 b / (64/8)   EXPORTS PER CAPITA ≥ USD 261 / (109/21)  *   Data are from 2008. Numbers indicate:
                                                                                                          value (World Ranking / Regional Ranking).
                   TOTAL EXPORTS ≥ USD 2.9 b / (107/19)  GDPpc ≥ USD 5,596 / (63/10)  EXPORTS AS SHARE OF GDP ≥ 4.7 % (128/21)    Latin America and the Caribbean.

                    ELECTRONICS  MACHINERY  AIRCRAFT   bOILERS   SHIPS   METAL PRODUCTS  CONSTR. MATL. & EqPT.  HOME & OFFICE  PULP & PAPER  CHEMICALS & HEALTH  AGROCHEMICALS  OTHER CHEMICALS  INOR. SALTS & ACIDS  PETROCHEMICALS  LEATHER  MILK & CHEESE  ANIMAL FIbERS  MEAT & EGGS  FISH & SEAFOOD  TROPICAL AGRIC.  CEREALS & vEG. OILS  COTTON/RICE/SOY & OTHERS  TObACCO  FRUIT  MISC. AGRICULTURE  NOT CLASSIFIED  TEXTILE & FAbRICS  GARMENTS  FOOD PROCESSING  bEER/SPIRITS & CIGS.  PRECIOUS STONES  COAL  OIL  MINING


                        EXPORT                                                      EXPORT
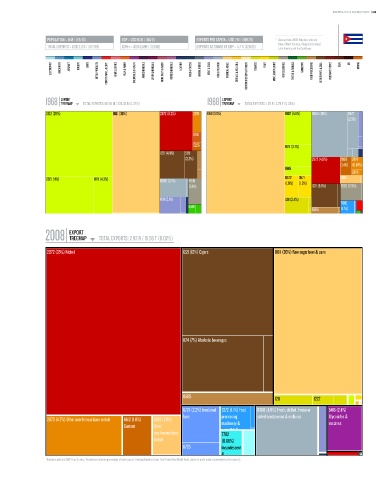
                  1968 TREEMAP  TOTAL EXPORTS: 157.55 M / 228.33 b (0.07%)    1988 TREEMAP  TOTAL EXPORTS: 1.29 b / 2.79 T (0.05%)
                                        Total Exports: 157.55 M / 228.33 B (0.07%)                   Total Exports: 1.29 B / 2.79 T (0.05%)
                  0612 (28%)               0611 (30%)        2872 (8.2%)  2871  0611 (50%)                 0612 (5.6%)  0360 (10%)  0372
                                                                                                                                  (2.5%)


                                                                         6811
                                                                         5225                              0711 (3.7%)
                                                             1221 (4.3%)  5121
                                                                      (2.3%)                                         2872 (4.8%)  2890  2871
                                                                                                                                (1.4%) (0.87%)
                                                                                                           0615
                                                                                                                                    2879
                  0615 (11%)        0711 (4.3%)              0360 (3.1%)  9610                             0572  0571           2882
                                                                       (2.1%)                              (1.9%)  (1.8%)  1221 (3.8%)  2820 (2.3%)

                                                             0111 (2.1%)                                   1211 (2.4%)
                                                                                                                                7842
                                                                       6581
                                                                                                                     0585       (1.1%)


                           EXPORT
                  2008 TREEMAP        TOTAL EXPORTS: 2.92 b / 15.56 T (0.02%)
                                                                 Total Exports: 2.92 B / 15.56 T (0.02%)
                   2872 (35%) Nickel                                 1221 (12%) Cigars                 0611 (20%) Raw sugar beet & cane


                                                                     1124 (7%) Alcoholic beverages


                                                                     0585                              1211           1222

                                                                     6724 (2.2%) Iron/steel 7272 (1.1%) Food  0360 (4.8%) Fresh, chilled, frozen or  5416 (2.4%)
                                                                     bars          processing    salted crustaceans & molluscs  Glycosides &
                   2879 (4.7%) Other non-ferrous base metals  6612 (1.8%)  2882 (1.8%)
                                               Cement     Other                    machinery &                             vaccines
                                                          non-ferrous base         parts N.E.S.
                                                                                   7782
                                                          metals                   (0.88%)
                                                                     6725          Incandescent
                                                                                   &
                  * Numbers indicate SITC-4 rev 2 codes. Parenthesis indicate percentage of total exports. Treemap Headers show: Total Trade/Total World Trade (share of world trade represented by the country).
   143   144   145   146   147   148   149   150   151   152   153