
Page 168 - The Atlas of Economic Complexity
P. 168
MAPPING PATHS TO PROSPERITY | 169
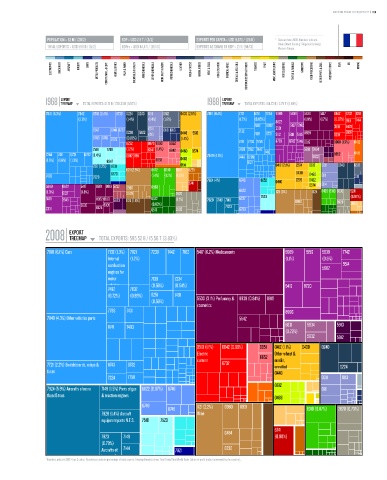
POPULATION ≥ 62 M / (20/2) GDP ≥ USD 2.9 T / (5/2) EXPORTS PER CAPITA ≥ USD 9,570 / (25/11) * Data are from 2008. Numbers indicate:
value (World Ranking / Regional Ranking).
TOTAL EXPORTS ≥ USD 596 b / (5/2) GDPpc ≥ USD 44,471 / (16/10) EXPORTS AS SHARE OF GDP ≥ 21 % (94/13) Western Europe.
ELECTRONICS MACHINERY AIRCRAFT bOILERS SHIPS METAL PRODUCTS CONSTR. MATL. & EqPT. HOME & OFFICE PULP & PAPER CHEMICALS & HEALTH AGROCHEMICALS OTHER CHEMICALS INOR. SALTS & ACIDS PETROCHEMICALS LEATHER MILK & CHEESE ANIMAL FIbERS MEAT & EGGS FISH & SEAFOOD TROPICAL AGRIC. CEREALS & vEG. OILS COTTON/RICE/SOY & OTHERS TObACCO FRUIT MISC. AGRICULTURE NOT CLASSIFIED TEXTILE & FAbRICS GARMENTS FOOD PROCESSING bEER/SPIRITS & CIGS. PRECIOUS STONES COAL OIL MINING
EXPORT EXPORT
1968 TREEMAP TOTAL EXPORTS: 12.71 b / 228.33 b (5.57%) 1988 TREEMAP TOTAL EXPORTS: 164.72 b / 2.79 T (5.89%)
Total Exports: 12.71 B / 228.33 B (5.57%) Total Exports: 164.72 B / 2.79 T (5.89%)
7810 (8.3%) 7842 6746 (2.4%) 6733 0224 0240 0111 6512 0430 (2.5%) 7810 (8.4%) 7721 6251 7234 5989 5839 5530 5417 6842 6732 8211
(3.8%) (1.4%) (1.4%) (1.6%) (1.7%) (0.85%) 8822 (1.9%) (1.7%) (0.97%) 6911 7414
7492 6782 5137 5982 3510 6428
6747 6749 6727 0011 6118 6113 7132 2331
0230 5922 (1%) 0440 5513 7139 6731 5112 5311 5145 8939 8219 6997
6783 6716 6725 (0.87%) (1.4%)
6732 6973 8960 6652 7491 7783 7758 8720 8742 5146 0819 8960 (1.5%) 6412
7518 7788 (1.2%) 6341 (1.4%) 8842 0460 0574 7499 7162 7442 7416 5831 5834
7244 7411 6731 6782 (1.4%) 6842 6911 7849 (4.9%) 7449 6289 5832 6652 6415
(1.6%) (1.6%) (1.3%) 8947 6953 0482 8121
7131 (1.2%) 8731 0541 0412 (2.1%) 2224 0612 0011 0240 6512
1121 (2.9%) 8472 8510 6841 5225
6770 0430 0460
7499 7928 (1.4%) (1.2%) (1.2%) 0111 2111
2741 7924 (4%) 6746 6252 0440 2226 0482 0114
5989 8822 5417 8921 0819 5232 0565 6560 0574
(1.3%) 5137 (1.8%) 0579 2820 6822 1121 (3%) 1124 8439 8310 5833 5241
5148 3345 8922 6573 5623 1124 (1.8%) 6522 (1.1%) 7929 7149 7148 6727 7523 0980 8928 (0.97%)
5530 5335 (0.83%) 7923 2882
2331 6424 6513 2665 6783
EXPORT
2008 TREEMAP TOTAL EXPORTS: 595.52 b / 15.56 T (3.83%)
Total Exports: 595.52 B / 15.56 T (3.83%)
7810 (6.1%) Cars 7132 (1.3%) 7821 7239 7442 7162 5417 (6.2%) Medicaments 5989 5156 5839 7742
Internal (1.2%) (1.1%) (0.5%)
combustion 5982 5514
engines for
motor 7139 7234
vehicles (0.56%) (0.54%) 5416 8720
7492 7832
(0.72%) (0.69%) 6251 7491 5530 (3.1%) Perfumery & 8939 (0.84%) 0819
(0.56%)
cosmetics
7783 7431 8996
7849 (4.3%) Other vehicles parts 5542
8741 7493 5831 5834 5913
(0.73%)
5832 5912
3510 (1.1%) 6842 (0.66%) 8851 0412 (1.1%) 0430 0240
Electric Other wheat &
current 6652 meslin,
7721 (2.2%) Switchboards, relays & 8743 6782 6732 unmilled 0224
fuses 0440
7224 7758 0011 0113
0612
7924 (5.9%) Aircrafts of more 7149 (1.5%) Parts of gas 6822 (0.67%) 6746 0111
than 15 tons & reaction engines 0488
6749 1121 (2.2%) 0980 8931
6745 8310 (0.87%) 2820 (0.73%)
7929 (1.4%) Aircraft Wine
equipment parts N.E.S. 7518 7523
5241
0484
7923 7148 (0.98%)
(0.78%)
Aircrafts of 7144 7921 0730
between 2
* Numbers indicate SITC-4 rev 2 codes. Parenthesis indicate percentage of total exports. Treemap Headers show: Total Trade/Total World Trade (share of world trade represented by the country).