
Page 164 - The Atlas of Economic Complexity
P. 164
MAPPING PATHS TO PROSPERITY | 165
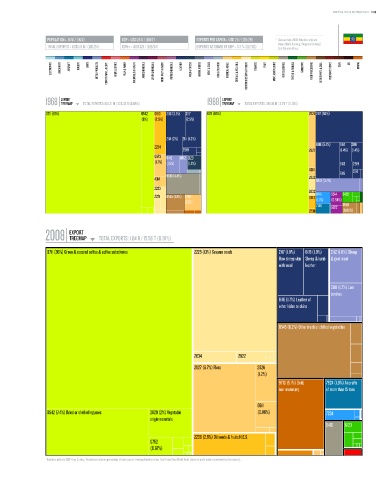
POPULATION ≥ 81 M / (16/2) GDP ≥ USD 26 b / (88/7) EXPORTS PER CAPITA ≥ USD 20 / (128/26) * Data are from 2008. Numbers indicate:
value (World Ranking / Regional Ranking).
TOTAL EXPORTS ≥ USD 1.6 b / (120/24) GDPpc ≥ USD 321 / (126/24) EXPORTS AS SHARE OF GDP ≥ 6.3 % (127/26) Sub-Saharan Africa.
ELECTRONICS MACHINERY AIRCRAFT bOILERS SHIPS METAL PRODUCTS CONSTR. MATL. & EqPT. HOME & OFFICE PULP & PAPER CHEMICALS & HEALTH AGROCHEMICALS OTHER CHEMICALS INOR. SALTS & ACIDS PETROCHEMICALS LEATHER MILK & CHEESE ANIMAL FIbERS MEAT & EGGS FISH & SEAFOOD TROPICAL AGRIC. CEREALS & vEG. OILS COTTON/RICE/SOY & OTHERS TObACCO FRUIT MISC. AGRICULTURE NOT CLASSIFIED TEXTILE & FAbRICS GARMENTS FOOD PROCESSING bEER/SPIRITS & CIGS. PRECIOUS STONES COAL OIL MINING
EXPORT EXPORT
1968 TREEMAP TOTAL EXPORTS: 106.21 M / 228.33 b (0.05%) 1988 TREEMAP TOTAL EXPORTS: 355.91 M / 2.79 T (0.01%)
Total Exports: 106.21 M / 228.33 B (0.05%) Total Exports: 355.91 M / 2.79 T (0.01%)
0711 (61%) 0542 0813 2116 (3.1%) 2117 0711 (65%) 2925 2117 (9.1%)
(8%) (2.5%) (2.5%)
2114 (2%) 2111 (1.3%)
6116 (5.4%) 6114 2116
2234
2919 2927 (1.4%) (1.4%)
0573 0149 0012 2120
(1.7%) (1.5%) (1.2%) 6113 2919
4314 2114
9610 (4.4%) 6115
4314 2922 0012 (3.7%)
2223
2632
2221 0545 (1.9%) 2783 0813 8741 5514 8462
(1.7%) (1.1%) (0.94%)
7148 5322 0545
2238 (0.99%)
EXPORT
2008 TREEMAP TOTAL EXPORTS: 1.64 b / 15.56 T (0.01%)
Total Exports: 1.64 B / 15.56 T (0.01%)
0711 (36%) Green & roasted coffee & coffee substitutes 2225 (13%) Sesame seeds 2117 (1.9%) 6115 (1.8%) 0112 (1.8%) Sheep
Raw sheep skin Sheep & lamb & goat meat
with wool leather
0011 (1.7%) Live
bovines
6116 (1.7%) Leather of
other hides or skins
0545 (6.2%) Other fresh or chilled vegetables
2634 2922
2927 (6.7%) Flora 2926
(1.2%)
9710 (5.1%) Gold, 7924 (1.8%) Aircrafts
non-monetary of more than 15 tons
0611
0542 (7.4%) Dried or shelled legumes 2929 (2%) Vegetable (0.86%) 7234
origin materials
9410 6123
2238 (2.6%) Oil seeds & fruits N.E.S.
0752
(0.67%)
* Numbers indicate SITC-4 rev 2 codes. Parenthesis indicate percentage of total exports. Treemap Headers show: Total Trade/Total World Trade (share of world trade represented by the country).