
Page 174 - The Atlas of Economic Complexity
P. 174
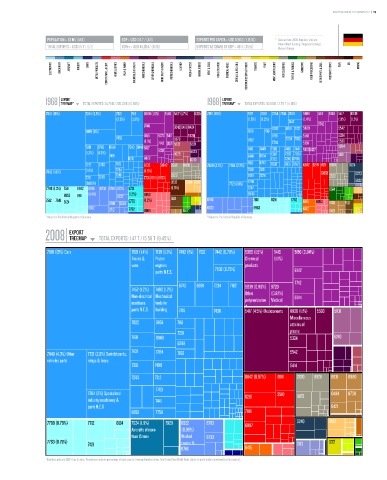
MAPPING PATHS TO PROSPERITY  |  175


                   POPULATION ≥ 82 M / (14/1)  GDP ≥ USD 3.6 T / (4/1)    EXPORTS PER CAPITA ≥ USD 17,903 / (15/10)  *   Data are from 2008. Numbers indicate:
                                                                                                          value (World Ranking / Regional Ranking).
                   TOTAL EXPORTS ≥ USD 1.5 T / (1/1)  GDPpc ≥ USD 44,264 / (17/11)  EXPORTS AS SHARE OF GDP ≥ 40 % (45/5)    Western Europe.

                    ELECTRONICS  MACHINERY  AIRCRAFT   bOILERS   SHIPS   METAL PRODUCTS  CONSTR. MATL. & EqPT.  HOME & OFFICE  PULP & PAPER  CHEMICALS & HEALTH  AGROCHEMICALS  OTHER CHEMICALS  INOR. SALTS & ACIDS  PETROCHEMICALS  LEATHER  MILK & CHEESE  ANIMAL FIbERS  MEAT & EGGS  FISH & SEAFOOD  TROPICAL AGRIC.  CEREALS & vEG. OILS  COTTON/RICE/SOY & OTHERS  TObACCO  FRUIT  MISC. AGRICULTURE  NOT CLASSIFIED  TEXTILE & FAbRICS  GARMENTS  FOOD PROCESSING  bEER/SPIRITS & CIGS.  PRECIOUS STONES  COAL  OIL  MINING


                        EXPORT                                                      EXPORT
                  1968 TREEMAP*  TOTAL EXPORTS: 24.78 b / 228.33 b (10.85%)   1988 TREEMAP*  TOTAL EXPORTS: 113.86 b / 2.79 T (11.16%)
                                        Total Exports: 24.78 B / 228.33 B (10.85%)                   Total Exports: 311.86 B / 2.79 T (11.16%)
                  7810 (15%)     7244 (3.5%)  7821  7411  5989 (1.6%)  5148 5417 (1.7%)  5335  7810 (13%)  7821  7452  7264 7244 7493  5989  5311  8748 5417  8939
                                            (2.3%)  (1.9%)                                   (1.5%)  (1.2%)       (1.4%)       (1.1%)  (1.1%)
                                                                                                            7442
                                                       8745       5542 6419 6424                      6782  6991 7132 5839  8742  5542
                                 7499 (3%)                                                   7139  7361
                                                       5155  8720 5411  5530                          7491        5148         5334
                                            7452                  6573                                     7234 7822
                                                       (1.1%)  7742 2671 5232  5621          7492     7783        5156         5530
                                 7281  6782  6991  7243 6940 5137                            7416  7449  7369  7436 7441 58365137  5834
                                 (1.3%) (1.3%)              5331  5629  5623                          7367  7362 7784
                                          7491                                               6418  6954                        5831
                                                 6731  8822             6210                          7372  7243 8749
                                 7212  7783  7126      6732  6842 2665  8928  7849 (4.7%)  7284 (2.2%)  7162  8743  7832  7831 7252 6842 8219 8211 8928  0224
                  7842 (4.1%)    (1.1%)     7784       (1.3%)                                7428  7281                  6428        0223
                                 7371  7283  7919      7731 6911 6973  2820                  7499  7224                     2820     5922
                                 (0.89%)                         3232  6998 6812      7721 (1.8%)  7758
                  7788 (1.3%) 7511  8942  6746  6733 6783 6725  8731  (1.5%)                 7247                           6514
                         8852  8811  (1.4%)  6727  (1.2%)  6953                              6940
                  7512 7518  8124         6749 5224  6770  (1.2%)  5121       6746             7611   8124   7782  6415  6953  8931  5121
                                  6822           7782                         6822             8983               6412
                                          6712         6960          6517                                                   6421
                  * values for The Federal Republic of Germany                * values for The Federal Republic of Germany

                           EXPORT
                  2008 TREEMAP        TOTAL EXPORTS: 1.47 T / 15.56 T (9.45%)
                                                                 Total Exports: 1.47 T / 15.56 T (9.45%)
                   7810 (13%) Cars                7821 (1.4%)  7139 (1.3%)  7492 (1%) 7132  7442 (0.79%)  5989 (1.5%)  5416  5156 (0.84%)
                                                  Trucks &  Piston                          Chemical   (1.1%)
                                                  vans     engines                          products
                                                           parts N.E.S.          7832 (0.75%)                  8742

                                                                                                               7742
                                                                    8743  6991   7234  7162  5839 (0.96%) 8720
                                                  7452 (1.2%)  7493 (1.2%)
                                                  Non-electrical Mechanical                 Other     (0.87%)  8744
                                                  machines  tools for                       polymerization Medical
                                                  parts N.E.S.  building  7416   7436       &         instruments  8939 (1.1%)  5530  5831
                                                                                            5417 (4.5%) Medicaments
                                                                                            copolymarization N.E.S.
                                                  7822     6954    7161                     products         Miscellaneous
                                                                                                             articles of
                                                                   7281                                      plastic
                                                  7491     6940                                              5334            6210
                                                                   6289
                                                  7431     7264                                              5542
                   7849 (4.3%) Other  7721 (2.6%) Switchboards,    7188
                   vehicles parts  relays & fuses
                                                  7361     7499                                              5414

                                                  7283     7212                             6842 (0.97%)  6911  2820  8928  8931   0980

                                                           7783
                                  7284 (2%) Specialized                                     8219        3510   5823         0484   0730
                                  industry machinery &     7441
                                  parts N.E.S                                                                               6421
                                                  6782     7758                             7861

                   7788 (0.78%)   7712      8124  7924 (1.9%)  7929  6822     6783          6997               0240        2882
                                                  Aircrafts of more  (0.99%)
                                                  than 15 tons      Worked    6733
                   7763 (0.75%)                                     copper &                                               1222
                                  7421                                                                         0113
                                                                    6746                    6415
                                                                    copper alloys
                  * Numbers indicate SITC-4 rev 2 codes. Parenthesis indicate percentage of total exports. Treemap Headers show: Total Trade/Total World Trade (share of world trade represented by the country).