
Page 178 - The Atlas of Economic Complexity
P. 178
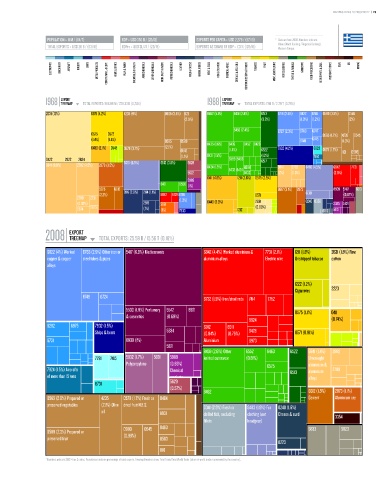
MAPPING PATHS TO PROSPERITY  |  179


                   POPULATION ≥ 11 M / (64/7)  GDP ≥ USD 350 b / (26/12)  EXPORTS PER CAPITA ≥ USD 2,278 / (57/16)  *   Data are from 2008. Numbers indicate:
                                                                                                          value (World Ranking / Regional Ranking).
                   TOTAL EXPORTS ≥ USD 26 b / (63/16)  GDPpc ≥ USD 31,174 / (23/15)  EXPORTS AS SHARE OF GDP ≥ 7.3 % (126/16)    Western Europe.

                    ELECTRONICS  MACHINERY  AIRCRAFT   bOILERS   SHIPS   METAL PRODUCTS  CONSTR. MATL. & EqPT.  HOME & OFFICE  PULP & PAPER  CHEMICALS & HEALTH  AGROCHEMICALS  OTHER CHEMICALS  INOR. SALTS & ACIDS  PETROCHEMICALS  LEATHER  MILK & CHEESE  ANIMAL FIbERS  MEAT & EGGS  FISH & SEAFOOD  TROPICAL AGRIC.  CEREALS & vEG. OILS  COTTON/RICE/SOY & OTHERS  TObACCO  FRUIT  MISC. AGRICULTURE  NOT CLASSIFIED  TEXTILE & FAbRICS  GARMENTS  FOOD PROCESSING  bEER/SPIRITS & CIGS.  PRECIOUS STONES  COAL  OIL  MINING


                        EXPORT                                                      EXPORT
                  1968 TREEMAP  TOTAL EXPORTS: 556.98 M / 228.33 b (0,24%)    1988 TREEMAP  TOTAL EXPORTS: 7.98 b / 2.79 T (0.29%)
                                        Total Exports: 556.98 M / 228.33 B (0.24%)                   Total Exports: 7.98 B / 2.79 T (0.29%)
                  2631 (13%)       0571 (4.2%)  4235 (9%)     0565 (3.4%) 1121  8462 (5.1%)  8451 (2.8%)  6513  6716 (2.5%)  6822  6746 0589 (3.5%)  0546
                                                                      (2.5%)                      (3.8%)         (1.3%) (1.2%)     (2%)

                                                                                        8459 (2.4%)     6727 (2.3%)  6783  6747
                                   0575  0572                                                                            0565 (1.7%) 4235  0545
                                   (1.4%)  (1.4%)             0585  0589                                         6749  6745     (1.3%)
                                   0430 (2.1%) 0548  0579 (3.7%)  (2.1%)      8435 (1.6%)  8439  8452 8423  7932 (4.2%)  6623
                                                                    0546              (1.4%)      6522                   0579 (1.7%)  1121  0585
                                                                    (1.1%)    8431 (1.5%)         (1.2%)              7144
                  0422   2922  2634                                                   6589 8463   6517
                  6841 (9.9%)  2782 (4.5%)  2873 (3.5%)  6130 (6.5%)  6513 (3.5%)  5629  8434 (1.5%)  6584  6841  2782  8483 (4.5%)  6842  7731
                                                                       5622           8433 8424  8432   (2%)  (1.3%)         (2.5%)
                                                                              0411 (4.6%)  1211 (3.6%) 0575 (2.5%)
                                                                       5989
                                                             8471   6560  (1%)
                                      5225  6612                                                        6612 (3.1%) 2873     8939 5417  6613
                                      (2.2%)   2116 (2.9%)  2114 (1.1%)  6842  69246716         0571               6130          (0.87%)
                              2789  2731                            (1.3%)
                              (0.92%)                 2919   5981             0440 (2.3%)       2631               0240 0350  3345 5621
                              2874  2875              (1%)   (1%)   7933                 1212   (0.99%)                  6512  5113


                           EXPORT
                  2008 TREEMAP        TOTAL EXPORTS: 25.58 b / 15.56 T (0.16%)
                                                                 Total Exports: 25.58 B / 15.56 T (0.16%)
                   6822 (4%) Worked  6783 (2.9%) Other iron or 5417 (6.8%) Medicaments  6842 (4.4%) Worked aluminium &  7731 (2.1%)  1211 (1.8%)  2631 (1.8%) Raw
                   copper & copper  steel tubes & pipes                      aluminium alloys       Electric wire  Unstripped tobacco  cotton
                   alloys


                                                                                                               1222 (1.2%)
                                                                                                               Cigarretes   2223
                                6749  6724                                   6732 (1.9%) Iron/steel rods 7414  7752

                                                5530 (1.9%) Perfumery  5542  8921                              0575 (1.1%)  0411
                                                & cosmetics    (0.69%)
                                                                                              6624                          (0.74%)
                   6282    6975     7932 (1.5%)                              6912     6911
                                    Ships & boats              5334          (0.84%)  (0.76%)  6428            0571 (0.91%)
                   6731                         8939 (1%)                    Aluminium        6973
                                                               5821          structures
                                                                             8459 (2.6%) Other  6552  8463   6522   6841 (1.4%)  2882
                                    7781  7415  5832 (1.7%)  5831  5989      knitted outerwear  (0.81%)             Unwrought
                                                Polypropylene   (0.93%)                             6575            aluminium &
                   7924 (1.5%) Aircrafts                        Chemical                                     6513   aluminium  2789
                   of more than 15 tons                         products                                            alloys
                                    8731                        5629
                                                                (0.57%)
                                                                             8462                                   6612 (1.5%)  2873 (1.1%)
                   0565 (2.8%) Prepared or  4235  0579 (1.7%) Fresh or  0484                                        Cement    Aluminium ore
                   preserved vegetables  (2.1%) Olive dried fruit N.E.S.     0341 (2.9%) Fresh or  8483 (1.9%) Fur  0240 (1.6%)
                                       oil                   8931            chilled fish, excluding  clothing (not  Cheese & curd
                                                                             fillets         headgear)                        3354
                                               0980    0545  0483                                                   5833        5823
                   0589 (2.3%) Prepared or
                   preserved fruit             (0.98%)       0583
                                                                                                         0223
                                                             1110
                  * Numbers indicate SITC-4 rev 2 codes. Parenthesis indicate percentage of total exports. Treemap Headers show: Total Trade/Total World Trade (share of world trade represented by the country).