
Page 180 - The Atlas of Economic Complexity
P. 180
MAPPING PATHS TO PROSPERITY | 181
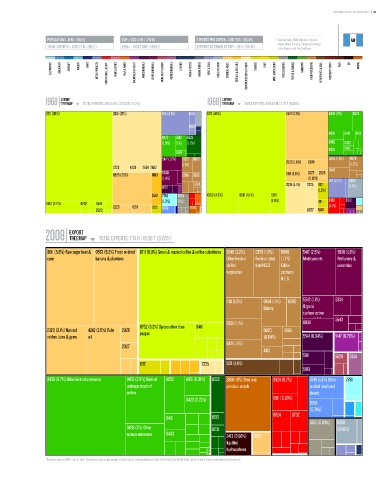
POPULATION ≥ 14 M / (58/8) GDP ≥ USD 39 b / (78/11) EXPORTS PER CAPITA ≥ USD 566 / (93/19) * Data are from 2008. Numbers indicate:
value (World Ranking / Regional Ranking).
TOTAL EXPORTS ≥ USD 7.7 b / (86/11) GDPpc ≥ USD 2,860 / (86/17) EXPORTS AS SHARE OF GDP ≥ 20 % (101/15) Latin America and the Caribbean.
ELECTRONICS MACHINERY AIRCRAFT bOILERS SHIPS METAL PRODUCTS CONSTR. MATL. & EqPT. HOME & OFFICE PULP & PAPER CHEMICALS & HEALTH AGROCHEMICALS OTHER CHEMICALS INOR. SALTS & ACIDS PETROCHEMICALS LEATHER MILK & CHEESE ANIMAL FIbERS MEAT & EGGS FISH & SEAFOOD TROPICAL AGRIC. CEREALS & vEG. OILS COTTON/RICE/SOY & OTHERS TObACCO FRUIT MISC. AGRICULTURE NOT CLASSIFIED TEXTILE & FAbRICS GARMENTS FOOD PROCESSING bEER/SPIRITS & CIGS. PRECIOUS STONES COAL OIL MINING
EXPORT EXPORT
1968 TREEMAP TOTAL EXPORTS: 269.04 M / 228.33 b (0,12%) 1988 TREEMAP TOTAL EXPORTS: 969.78 M / 2.79 T (0.03%)
Total Exports: 269.04 M / 228.33 B (0.12%) Total Exports: 969.78 M / 2.79 T (0.03%)
0711 (38%) 2631 (17%) 0111 (4.1%) 0141 0711 (40%) 0573 (13%) 8439 (3%) 8423
0616
8435 8441 8431
8472 8510 6522
(1.9%) (1%) (1.7%) 8462 8463
8434 8452
6581
5417 (1.7%) 0620 0980 0545 (1.5%) 0579
(1.1%) 2926 (1.6%) 2320 (1.2%)
2223 4233 2634 2632 0546
5530 2927 2925
0573 (7.8%) 0813 0545 0585 0611 (1.5%)
(1.4%) (0.82%) 0111 (2.1%) 0360
0914 2631 (4.1%) 2225 1212
0712 (1.7%)
(1.2%)
5513 7781 6651 0752 (4.2%) 0612 (4.1%) 0615
(1.2%) (1%) (1.9%) 1211 2483 5913
0612 (2.7%) 0752 0541 2320 0611 (1.1%)
2929 1222 6749 2890 0577 5513
EXPORT
2008 TREEMAP TOTAL EXPORTS: 7.74 b / 15.56 T (0.05%)
Total Exports: 7.74 B / 15.56 T (0.05%)
0611 (5.8%) Raw sugar beet & 0573 (5.2%) Fresh or dried 0711 (9.8%) Green & roasted coffee & coffee substitutes 0545 (2.2%) 0579 (1.9%) 0980 5417 (2.5%) 5530 (1.9%)
cane banana & plantains Other fresh or Fresh or dried (1.7%) Medicaments Perfumery &
chilled fruit N.E.S. Edible cosmetics
vegetables products
N.E.S.
1110 (1.2%) 0484 (1.1%) 0585 5542 (1.1%) 5334
Bakery Organic
surface-active
agents N.E.S. 5543
8931 (1.1%) 8939
0752 (3.2%) Spices other than 0481
2320 (3.1%) Natural 4242 (2.5%) Palm 2926 pepper 0620 0565
rubber, latex & gums oil (0.64%) 5541 (0.94%) 5147 (0.78%)
6421 (1.1%)
2927
4312
5911 5629 5834
1212 2225 5121 (1.4%)
5913
8459 (9.7%) Other knitted outerwear 8462 (2.9%) Knitted 6552 8451 (0.81%) 6522 2890 (4%) Ores and 6924 (0.7%) 6749 (1.3%) Other 7781
undergarments of precious metals worked iron/steel
cotton sheets
8423 (0.72%) 6911 (0.65%)
6783
(0.74%)
8431 6513 6624 6732
6651 (0.89%) 0360
8439 (2%) Other 6531 (0.85%)
women outerwear 8463 3413 (0.98%) 2882
liquified
hydrocarbons
* Numbers indicate SITC-4 rev 2 codes. Parenthesis indicate percentage of total exports. Treemap Headers show: Total Trade/Total World Trade (share of world trade represented by the country).