
Page 202 - The Atlas of Economic Complexity
P. 202
MAPPING PATHS TO PROSPERITY | 203
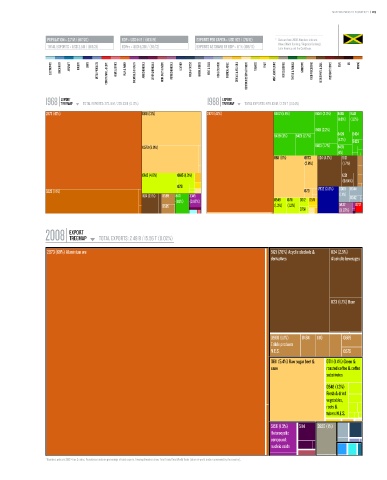
POPULATION ≥ 2.7 M / (117/20) GDP ≥ USD 14 b / (103/19) EXPORTS PER CAPITA ≥ USD 923 / (78/12) * Data are from 2008. Numbers indicate:
value (World Ranking / Regional Ranking).
TOTAL EXPORTS ≥ USD 2.5 b / (110/21) GDPpc ≥ USD 5,301 / (66/12) EXPORTS AS SHARE OF GDP ≥ 17 % (108/17) Latin America and the Caribbean.
ELECTRONICS MACHINERY AIRCRAFT bOILERS SHIPS METAL PRODUCTS CONSTR. MATL. & EqPT. HOME & OFFICE PULP & PAPER CHEMICALS & HEALTH AGROCHEMICALS OTHER CHEMICALS INOR. SALTS & ACIDS PETROCHEMICALS LEATHER MILK & CHEESE ANIMAL FIbERS MEAT & EGGS FISH & SEAFOOD TROPICAL AGRIC. CEREALS & vEG. OILS COTTON/RICE/SOY & OTHERS TObACCO FRUIT MISC. AGRICULTURE NOT CLASSIFIED TEXTILE & FAbRICS GARMENTS FOOD PROCESSING bEER/SPIRITS & CIGS. PRECIOUS STONES COAL OIL MINING
EXPORT EXPORT
1968 TREEMAP TOTAL EXPORTS: 273.11 M / 228.33 b (0.12%) 1988 TREEMAP TOTAL EXPORTS: 979.83 M / 2.79 T (0.04%)
Total Exports: 273.11 M / 228.33 B (0.12%) Total Exports: 979.83 M / 2.79 T (0.04%)
2873 (47%) 0611 (13%) 2873 (42%) 8462 (5.8%) 8459 (2.3%) 8465 8441
(1.6%) (1.6%)
8451 (2.2%)
8439 (3%) 8423 (2.7%) 8429 8434
(1.2%) 8433
0573 (9.9%) 8463 (1.7%) 8435
(1%)
0611 (8%) 0573 1124 (4.7%) 5121
(2.8%) (1.7%)
0612 (4.6%) 0615 (1.3%) 1221
(0.94%)
0751 7932 (3.6%) 0360 0344
5225 (14%) 0721
1124 (2.1%) 0589 8471 3345 (1.1%) 0342
(1.8%) (0.87%) 0548 0711 0612 0571
0585 (1.3%) (1.2%) 5832 8212
0751 (0.97%)
EXPORT
2008 TREEMAP TOTAL EXPORTS: 2.48 b / 15.56 T (0.02%)
Total Exports: 2.48 B / 15.56 T (0.02%)
2873 (69%) Aluminium ore 5121 (7.8%) Acyclic alcohols & 1124 (2.5%)
derivatives Alcoholic beverages
1123 (1.7%) Beer
0980 (1.1%) 0484 1110 0589
Edible products
N.E.S. 0579
0611 (5.4%) Raw sugar beet & 0711 (1.4%) Green &
cane roasted coffee & coffee
substitutes
0548 (1.3%)
Fresh & dried
vegetables,
roots &
tubers N.E.S.
5156 (1.3%) 5114 2820 (1%)
Heterocyclic
compound;
nucleic acids
* Numbers indicate SITC-4 rev 2 codes. Parenthesis indicate percentage of total exports. Treemap Headers show: Total Trade/Total World Trade (share of world trade represented by the country).