Page 206 - The Atlas of Economic Complexity
P. 206

MAPPING PATHS TO PROSPERITY  |  207


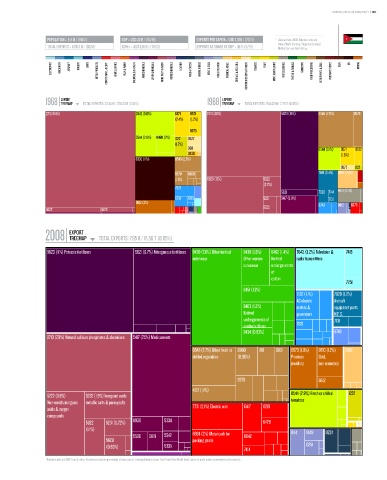
                   POPULATION ≥ 5.8 M / (90/11)  GDP ≥ USD 23 b / (93/16)  EXPORTS PER CAPITA ≥ USD 1,368 / (73/11)  *   Data are from 2008. Numbers indicate:
                                                                                                          value (World Ranking / Regional Ranking).
                   TOTAL EXPORTS ≥ USD 8 b / (82/14)  GDPpc ≥ USD 3,905 / (79/12)  EXPORTS AS SHARE OF GDP ≥ 35 % (57/9)    Middle East and North Africa.

                    ELECTRONICS  MACHINERY  AIRCRAFT   bOILERS   SHIPS   METAL PRODUCTS  CONSTR. MATL. & EqPT.  HOME & OFFICE  PULP & PAPER  CHEMICALS & HEALTH  AGROCHEMICALS  OTHER CHEMICALS  INOR. SALTS & ACIDS  PETROCHEMICALS  LEATHER  MILK & CHEESE  ANIMAL FIbERS  MEAT & EGGS  FISH & SEAFOOD  TROPICAL AGRIC.  CEREALS & vEG. OILS  COTTON/RICE/SOY & OTHERS  TObACCO  FRUIT  MISC. AGRICULTURE  NOT CLASSIFIED  TEXTILE & FAbRICS  GARMENTS  FOOD PROCESSING  bEER/SPIRITS & CIGS.  PRECIOUS STONES  COAL  OIL  MINING


                        EXPORT                                                      EXPORT
                  1968 TREEMAP  TOTAL EXPORTS: 33.54 M / 228.33 b (0.01%)     1988 TREEMAP  TOTAL EXPORTS: 764.43 M / 2.79 T (0.03%)
                                         Total Exports: 33.54 M / 228.33 B (0.01%)                   Total Exports: 764.43 M / 2.79 T (0.03%)
                  2713 (54%)                        0542 (5.8%)   0571  0574  2713 (30%)                  5623 (18%)    0545 (7.9%)  0579
                                                                  (2.4%)  (1.2%)

                                                                        0575
                                                    0544 (2.8%)  0460 (2%)  1222  0577
                                                                  (1.7%)
                                                                       0811                                             0544 (3.1%)  0571  0572
                                                                       0430                                                     (1.6%)
                                                    3330 (11%)    0545 (2.5%)
                                                                                                                                0577  1222
                                                                  0579  0620                                            7149 (2.4%) 2882 (2.1%)
                                                                  (1.1%)      5629 (13%)           5622
                                                                                                   (2.2%)
                                                                  7821                                                         6613 (2.1%)
                                                                                                          5621          7928 7144
                                                                  6731  7283                       5231   5417 (3.8%)      7131
                                                    6612 (3%)
                                                                                                   5232                 8743   0012  6973
                  5622                 5629


                           EXPORT
                  2008 TREEMAP        TOTAL EXPORTS: 7.95 b / 15.56 T (0.05%)
                                                                 Total Exports: 7.95 B / 15.56 T (0.05%)
                   5623 (11%) Potassic fertilizers  5621 (6.7%) Nitrogenous fertilizers  8459 (7.6%) Other knitted  8439 (1.6%)  8462 (1.4%)  7643 (3.2%) Television &  7415
                                                                         outerwear          Other women  Knitted  radio transmitters
                                                                                            outerwear  undergarments
                                                                                                      of
                                                                                                      cotton
                                                                                                                                  7751
                                                                                            8451 (1.3%)
                                                                                                               7162 (1.1%)   7929 (1.2%)
                                                                                                               AC electric   Aircraft
                                                                                            8463 (1.2%)        motors &      equipment parts
                                                                                            Knitted            generators    N.E.S.
                                                                                            undergarments of                 7131
                                                                                            synthetic fibers   7831
                                                                                            8434 (0.83%)                     6749
                   2713 (7.6%) Natural calcium phosphates & aluminium  5417 (7.5%) Medicaments

                                                                         0545 (2.7%) Other fresh or 0980  1110  8931  8973 (1.8%)  9710 (1.2%)  2882
                                                                         chilled vegetables  (0.96%)         Precious   Gold,
                                                                                                             jewellery  non-monetary


                                                                                         0579                           6612
                                                                         4312 (1.1%)
                   5222 (3.8%)   5232 (1.9%) Inorganic acids                                                 0544 (2.8%) Fresh or chilled  1222
                   Non-metals inorganic  metallic salts & peroxysalts                                        tomatoes
                   acids & oxygen                                        7731 (2.1%) Electric wire  6417  8219
                   compounds
                                 5622   5231 (0.72%)  8939    5334                                 6428
                                 (1.1%)                                                                      0114  0149   0224
                                                   5530  0819  5542      6924 (2%) Metal cask for  6842
                                        5629                             packing goods
                                        (0.63%)               5335                                                 0251
                                                                                            7414
                  * Numbers indicate SITC-4 rev 2 codes. Parenthesis indicate percentage of total exports. Treemap Headers show: Total Trade/Total World Trade (share of world trade represented by the country).
   201   202   203   204   205   206   207   208   209   210   211