Page 210 - The Atlas of Economic Complexity
P. 210

MAPPING PATHS TO PROSPERITY  |  211


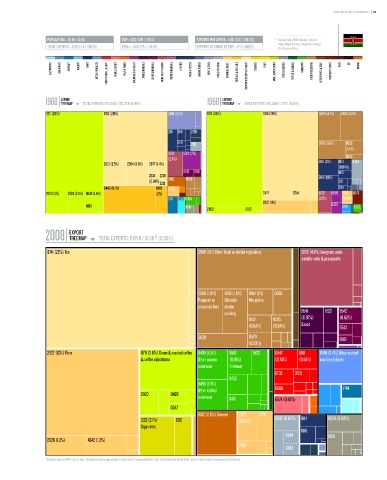
                   POPULATION ≥ 39 M / (31/6)  GDP ≥ USD 30 b / (81/5)    EXPORTS PER CAPITA ≥ USD 130 / (120/20)  *   Data are from 2008. Numbers indicate:
                                                                                                          value (World Ranking / Regional Ranking).
                   TOTAL EXPORTS ≥ USD 5.1 b / (96/10)  GDPpc ≥ USD 775 / (115/16)  EXPORTS AS SHARE OF GDP ≥ 17 % (110/21)    Sub-Saharan Africa.

                    ELECTRONICS  MACHINERY  AIRCRAFT   bOILERS   SHIPS   METAL PRODUCTS  CONSTR. MATL. & EqPT.  HOME & OFFICE  PULP & PAPER  CHEMICALS & HEALTH  AGROCHEMICALS  OTHER CHEMICALS  INOR. SALTS & ACIDS  PETROCHEMICALS  LEATHER  MILK & CHEESE  ANIMAL FIbERS  MEAT & EGGS  FISH & SEAFOOD  TROPICAL AGRIC.  CEREALS & vEG. OILS  COTTON/RICE/SOY & OTHERS  TObACCO  FRUIT  MISC. AGRICULTURE  NOT CLASSIFIED  TEXTILE & FAbRICS  GARMENTS  FOOD PROCESSING  bEER/SPIRITS & CIGS.  PRECIOUS STONES  COAL  OIL  MINING


                        EXPORT                                                      EXPORT
                  1968 TREEMAP  TOTAL EXPORTS: 170.69 M / 228.33 b (0.07%)    1988 TREEMAP  TOTAL EXPORTS: 896.34 M / 2.79 T (0.03%)
                                        Total Exports: 170.69 M / 228.33 B (0.07%)                   Total Exports: 896.34 M / 2.79 T (0.03%)
                  0711 (29%)            0741 (20%)              0149 (3.1%)   0711 (34%)           0741 (28%)           0589 (4.1%)  0545 (4.1%)


                                                                2111  2114  2120
                                                                   6118                                                 0579 (3.1%)  0585
                                                                        2911
                                                                                                                                  (1.4%)
                                                                5232  5322 (2%)
                                                                (2.4%)                                                            0565
                                        2631 (3.5%)  2654 (3.3%)  0577 (1.4%)                                           6116 (2%)  6113  0344
                                                                                                                               (0.94%)
                                                                     0819  8921                                                6115
                                                        2634 2235                                                       6114 (1.9%)
                                                        (0.84%)  6612  0589                                                    2111
                                                            2221
                                        0440 (9.1%)        0813  2876                                                          2114
                  2929 (3%)  2924 (2.5%) 0542 (1.4%)       (2%)                                    0577       2654      5232  5989 2785 6673
                                                                7131  8731 6354                                         (1.7%)  (0.83%)
                                                                                                   2927 (4%)
                                 0615                                 9610    2929          0615                            5322  8741  8997


                           EXPORT
                  2008 TREEMAP        TOTAL EXPORTS: 5.05 b / 15.56 T (0.03%)
                                                                 Total Exports: 5.05 B / 15.56 T (0.03%)
                   0741 (22%) Tea                                          0545 (6%) Other fresh or chilled vegetables  5232 (4.8%) Inorganic acids
                                                                                                                 metallic salts & peroxysalts


                                                                           0589 (1.8%)  8931 (1.6%)  0914 (1%)  0565
                                                                           Prepared or  Closable  Margarine
                                                                           preserved fruit plastic
                                                                                     packing                     5541     5621  5542
                                                                                              6421     0585      (0.97%)       (0.62%)
                                                                                              (0.64%)  (0.54%)   Soaps         5543

                                                                           0620               0579                             8921
                                                                                              (0.59%)
                   2927 (12%) Flora                  0711 (3.6%) Green & roasted coffee  8439 (1.5%)  8510  8423  6842  6911  6749 (2.4%) Other worked
                                                     & coffee substitutes  Other women  (0.91%)        (0.74%)  (0.64%)  iron/steel sheets
                                                                           outerwear  Footwear
                                                                                                       6732    3510
                                                                                      8432
                                                                           8459 (1.5%)
                                                                           Other knitted               6996                      7144
                                                     2929        0488
                                                                           outerwear  8451             6974 (0.82%)
                                                                 0542
                                                                           6612 (2.8%) Cement  2783  2785
                                                     1222 (2.1%)   1212                   (0.94%)      0342 (0.67%) 6114   8928 (0.98%)
                                                     Cigarretes
                                                                                                                 6116
                                                                                                           0344            6651
                   2926 (1.2%)    4242 (1.2%)
                                                                                          2882
                                                                                                           0343
                  * Numbers indicate SITC-4 rev 2 codes. Parenthesis indicate percentage of total exports. Treemap Headers show: Total Trade/Total World Trade (share of world trade represented by the country).
   205   206   207   208   209   210   211   212   213   214   215