
Page 230 - The Atlas of Economic Complexity
P. 230
MAPPING PATHS TO PROSPERITY | 231
POPULATION ≥ 2 M / (121/25) GDP ≥ USD 9.5 b / (112/24) EXPORTS PER CAPITA ≥ USD 1,857 / (62/16) * Data are from 2008. Numbers indicate:
value (World Ranking / Regional Ranking).
TOTAL EXPORTS ≥ USD 3.8 b / (104/22) GDPpc ≥ USD 4,663 / (71/19) EXPORTS AS SHARE OF GDP ≥ 40 % (47/12) Eastern Europe and Central Asia.
ELECTRONICS MACHINERY AIRCRAFT bOILERS SHIPS METAL PRODUCTS CONSTR. MATL. & EqPT. HOME & OFFICE PULP & PAPER CHEMICALS & HEALTH AGROCHEMICALS OTHER CHEMICALS INOR. SALTS & ACIDS PETROCHEMICALS LEATHER MILK & CHEESE ANIMAL FIbERS MEAT & EGGS FISH & SEAFOOD TROPICAL AGRIC. CEREALS & vEG. OILS COTTON/RICE/SOY & OTHERS TObACCO FRUIT MISC. AGRICULTURE NOT CLASSIFIED TEXTILE & FAbRICS GARMENTS FOOD PROCESSING bEER/SPIRITS & CIGS. PRECIOUS STONES COAL OIL MINING
EXPORT EXPORT
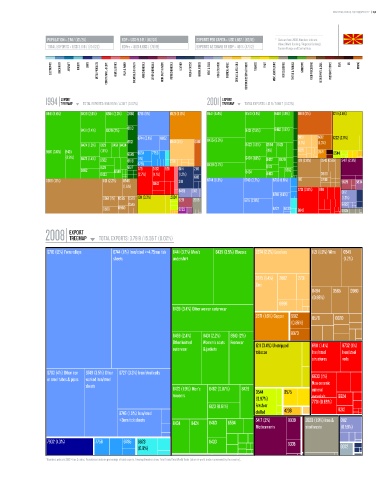
1994 TREEMAP TOTAL EXPORTS: 956.95 M / 4.30 T (0.02%) 2001 TREEMAP TOTAL EXPORTS: 1.12 b / 5.90 T (0.02%)
Total Exports: 956.95 M / 4.30 T (0.02%) Total Exports: 1.12 B / 5.90 T (0.02%)
8441 (8.4%) 8439 (2.6%) 6584 (2.3%) 2666 6716 (5%) 6821 (5.6%) 8441 (6.4%) 8510 (3.1%) 8459 (1.9%) 6861 (5%) 1211 (4.5%)
6513
8431 (2.4%) 8429 (2%) 8431 (2.6%) 8462 (1.8%)
6744 (2.1%) 6822 6851 6612 1222 (2.6%)
6521 6841 (3%) 6861 8435 (5.9%) (1.1%) (1.3%)
8424 (1.6%) 6123 8451 8434 8423 (1.8%) 6584 8421
8510 (3.6%) 8435 (1.1%) 6583 6954 7758 (1%) 2875 2871 0544
(2.8%) 8423 (1.4%) 6552 6516 (1%) 2731 8424 (1.8%) 8422 8429 1121 (2.8%) 0545 0565 5417 (2.3%)
8421 6517 6785 2483 8211 6114 2116 8439 (3.7%) 6123
7731
8462 6589 8434 6552
8433 (2.7%) (1.1%) (1.2%) 8463 0980
6113
0586 (13%) 1121 (2.2%) 0546 6842 2111 6744 (8.3%) 6749 (3.7%) 6783 (1.6%) 1110 0730 5629 5834
(1.6%)
8483 0112 7731 (2.8%) 6911 0112
0561 (1%) 0585 0579 1211 (3.3%) 2924 5221 2665 6716 (2.8%) 6746 (1.6%) (1.2%)
0545 8483
0589 0980 5233 6727 6733 6842 6935
EXPORT
2008 TREEMAP TOTAL EXPORTS: 3.79 b / 15.56 T (0.02%)
Total Exports: 3.79 B / 15.56 T (0.02%)
6716 (12%) Ferro-alloys 6744 (11%) Iron/steel >=4.75mm tick 8441 (3.7%) Men's 8435 (3.5%) Blouses 2874 (2.2%) Lead ore 1121 (1.9%) Wine 0545
sheets undershirt (1.2%)
2875 (1.4%) 2882 2731
Zinc
0484 0565 0980
(0.86%)
6998
8439 (3.4%) Other women outerwear
2871 (1.6%) Copper 6612 0579 0620
(0.55%)
8973
8459 (2.4%) 8431 (2.2%) 8510 (2%)
Other knitted Women's coats Footwear 1211 (3.4%) Unstripped 6911 (1.4%) 6732 (1%)
outerwear & jackets
tobacco Iron/steel Iron/steel
structures rods
6783 (4%) Other iron 6749 (3.5%) Other 6727 (3.3%) Iron/steel coils 6633 (1%)
or steel tubes & pipes worked iron/steel
sheets Non ceramic
8423 (1.9%) Men's 8462 (0.87%) 8429 0544 0575 mineral
trousers materials 6624
(0.97%) 7731 (0.69%)
6123 (0.81%) Fresh or N.E.S. 8212
6746 (1.9%) Iron/steel chilled 4236
<3mm tick sheets tomatoes 8939 2820 (1.9%) Iron & 0112
5417 (2%)
8434 8424 8463 6584
Medicaments steel waste (0.58%)
7932 (1.3%) 7758 6785 6623 8433 5335
(0.6%) 0372
* Numbers indicate SITC-4 rev 2 codes. Parenthesis indicate percentage of total exports. Treemap Headers show: Total Trade/Total World Trade (share of world trade represented by the country).