Page 232 - The Atlas of Economic Complexity
P. 232

MAPPING PATHS TO PROSPERITY  |  233


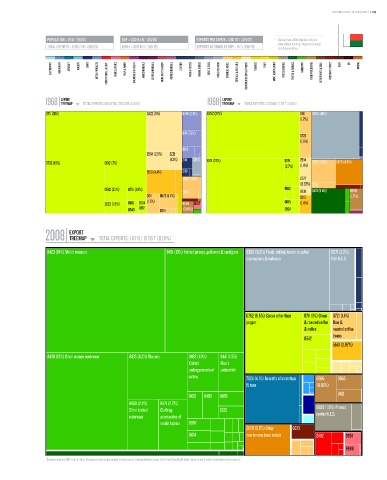
                   POPULATION ≥ 19 M / (50/11)  GDP ≥ USD 9.4 b / (113/18)  EXPORTS PER CAPITA ≥ USD 87 / (124/22)  *   Data are from 2008. Numbers indicate:
                                                                                                          value (World Ranking / Regional Ranking).
                   TOTAL EXPORTS ≥ USD 1.7 b / (119/23)  GDPpc ≥ USD 493 / (121/19)  EXPORTS AS SHARE OF GDP ≥ 18 % (106/19)    Sub-Saharan Africa.

                    ELECTRONICS  MACHINERY  AIRCRAFT   bOILERS   SHIPS   METAL PRODUCTS  CONSTR. MATL. & EqPT.  HOME & OFFICE  PULP & PAPER  CHEMICALS & HEALTH  AGROCHEMICALS  OTHER CHEMICALS  INOR. SALTS & ACIDS  PETROCHEMICALS  LEATHER  MILK & CHEESE  ANIMAL FIbERS  MEAT & EGGS  FISH & SEAFOOD  TROPICAL AGRIC.  CEREALS & vEG. OILS  COTTON/RICE/SOY & OTHERS  TObACCO  FRUIT  MISC. AGRICULTURE  NOT CLASSIFIED  TEXTILE & FAbRICS  GARMENTS  FOOD PROCESSING  bEER/SPIRITS & CIGS.  PRECIOUS STONES  COAL  OIL  MINING


                        EXPORT                                                      EXPORT
                  1968 TREEMAP  TOTAL EXPORTS: 139.57 M / 228.33 b (0.06%)    1988 TREEMAP  TOTAL EXPORTS: 317.31 M / 2.79 T (0.01%)
                                        Total Exports: 139.57 M / 228.33 B (0.06%)                   Total Exports: 317.31 M / 2.79 T (0.01%)
                  0711 (31%)                            0422 (9%)    0149 (2.3%)  0752 (27%)                     0611  0360 (14%)
                                                                                                                 (1.7%)

                                                                     0111 (1.9%)
                                                                                                                 0721
                                                                                                                 (1.6%)
                                                                     0011
                                                        2654 (2.6%)  2221
                                                                (1.2%)  2111  0360  0711 (27%)             0751  2654
                  0752 (19%)            0612 (7%)                                                                    2782 (3.5%)  2879 (4.3%)
                                                                                                           (2.7%)  (1.4%)
                                                        5513 (4.4%)  2119
                                                                     2782 (1.6%)                                 0577
                                                                                                                 (0.97%)  2785
                                        0542 (2.1%)  0751 (1.6%)                                           0612      6521 (5.4%)   0579
                                                                     2785                                        2631
                                                        0611  0573 (1.7%)                                        5513              (1.7%)
                                        2923 (1.8%)  0615  2924  (1.7%)  0564  6597                        0615  (1.4%)
                                                 0548  0812  0721    (0.88%)                               2924


                           EXPORT
                  2008 TREEMAP        TOTAL EXPORTS: 1.67 b / 15.56 T (0.01%)
                                                                 Total Exports: 1.67 B / 15.56 T (0.01%)
                   8423 (19%) Men's trousers                   8451 (13%) Knitted jerseys, pullovers & cardigans  0360 (8.2%) Fresh, chilled, frozen or salted  0371 (2.2%)
                                                                                             crustaceans & molluscs         Fish N.E.S.


                                                                                             0752 (5.5%) Spices other than  0711 (1%) Green  0721 (1.1%)
                                                                                             pepper               & roasted coffee Raw &
                                                                                                                  & coffee   roasted coffee
                                                                                                                  substitutes  beans
                                                                                                                  0542
                                                                                                                             5513 (0.97%)

                   8439 (12%) Other women outerwear  8435 (4.2%) Blouses  8462 (1.9%)  8441 (1.5%)
                                                                       Knitted     Men's
                                                                       undergarments of  undershirt
                                                                       cotton                7924 (4.1%) Aircrafts of more than  0586  0565
                                                                                             15 tons                   (0.93%)
                                                                       8433  8463  8429                                        6421
                                                 8459 (2.4%)  8471 (2.2%)
                                                 Other knitted  Clothing           6575                                8928 (1.6%) Printed
                                                 outerwear   accessories of                                            matter N.E.S.
                                                             textile fabrics  8997
                                                                                             2879 (2.2%) Other  6673
                                                                       8424                  non-ferrous base metals   2482       8851


                                                                                                                                  8998
                  * Numbers indicate SITC-4 rev 2 codes. Parenthesis indicate percentage of total exports. Treemap Headers show: Total Trade/Total World Trade (share of world trade represented by the country).
   227   228   229   230   231   232   233   234   235   236   237