
Page 236 - The Atlas of Economic Complexity
P. 236
MAPPING PATHS TO PROSPERITY | 237
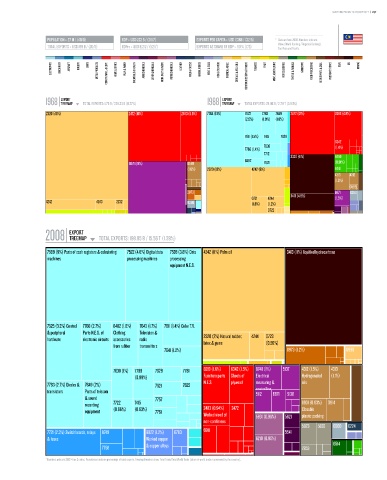
POPULATION ≥ 27 M / (40/8) GDP ≥ USD 222 b / (38/7) EXPORTS PER CAPITA ≥ USD 7,366 / (32/5) * Data are from 2008. Numbers indicate:
value (World Ranking / Regional Ranking).
TOTAL EXPORTS ≥ USD 199 b / (20/6) GDPpc ≥ USD 8,212 / (52/7) EXPORTS AS SHARE OF GDP ≥ 90 % (7/3) East Asia and Pacific.
ELECTRONICS MACHINERY AIRCRAFT bOILERS SHIPS METAL PRODUCTS CONSTR. MATL. & EqPT. HOME & OFFICE PULP & PAPER CHEMICALS & HEALTH AGROCHEMICALS OTHER CHEMICALS INOR. SALTS & ACIDS PETROCHEMICALS LEATHER MILK & CHEESE ANIMAL FIbERS MEAT & EGGS FISH & SEAFOOD TROPICAL AGRIC. CEREALS & vEG. OILS COTTON/RICE/SOY & OTHERS TObACCO FRUIT MISC. AGRICULTURE NOT CLASSIFIED TEXTILE & FAbRICS GARMENTS FOOD PROCESSING bEER/SPIRITS & CIGS. PRECIOUS STONES COAL OIL MINING
EXPORT EXPORT
1968 TREEMAP TOTAL EXPORTS: 1.75 b / 228.33 b (0.77%) 1988 TREEMAP TOTAL EXPORTS: 25.96 b / 2.79 T (0.93%)
Total Exports: 1.75 B / 228.33 B (0.77%) Total Exports: 25.96 B / 2.79 T (0.93%)
2320 (46%) 2472 (16%) 2483 (5.5%) 7764 (13%) 7622 7763 7649 2472 (12%) 2483 (4.8%)
(2.5%) (1.9%) (1.8%)
7611 (1.5%) 7415 7628
6342
7638
7768 (1.4%) (1.4%)
7712 3330 (11%) 8459
8482
6871 (19%) 0589 7621 (0.91%)
(1.6%) 2320 (13%) 4242 (6%) 8441
4313 4312
(1.6%)
0589
2873 6871 0360
0721 4244 3413 (4.8%) (1.5%)
4242 4243 2232 0360 (1.8%) (1.2%)
0723
EXPORT
2008 TREEMAP TOTAL EXPORTS: 198.85 b / 15.56 T (1.28%)
Total Exports: 198.85 B / 15.56 T (1.28%)
7599 (9%) Parts of cash registers & calculating 7522 (4.8%) Digital data 7528 (3.8%) Data 4242 (11%) Palm oil 3413 (11%) liquified hydrocarbons
machines processing machines processing
equipment N.E.S.
7525 (3.2%) Control 7768 (2.7%) 8482 (1.8%) 7643 (1.7%) 7611 (1.4%) Color T.V.
& peripheral Parts N.E.S. of Clothing Television &
hardware electronic circuits accessories radio 2320 (2%) Natural rubber, 4244 0723
(0.59%)
latex & gums
from rubber transmitters
7641 (1.2%) 8973 (1.2%) 6998
7638 (1%) 7788 7628 7781 8219 (1.6%) 6342 (1.5%) 8748 (1%) 5137 4312 (1.5%) 4313
(0.99%) Furniture parts Sheets of Electrical Hydrogenated (1.1%)
7763 (2.7%) Diodes & 7649 (2%) 7621 7622 N.E.S. plywood measuring & oils
transistors Parts of telecom controlling 6871 5138
5112
& sound 7757 instruments
recording 7722 7415 2483 (0.94%) 2472 N.E.S. 8931 (0.93%) 0914
equipment (0.96%) (0.93%) 7761 Closable
Worked wood of 5831 (0.96%) 5621 plastic packing
non-coniferous
5823 5833 0360 0224
7721 (2.3%) Switchboards, relays 8749 6822 (1.2%) 6783 6911 5541
& fuses Worked copper 6210 (0.95%)
7758 & copper alloys 7853 6514
* Numbers indicate SITC-4 rev 2 codes. Parenthesis indicate percentage of total exports. Treemap Headers show: Total Trade/Total World Trade (share of world trade represented by the country).