
Page 246 - The Atlas of Economic Complexity
P. 246
MAPPING PATHS TO PROSPERITY | 247
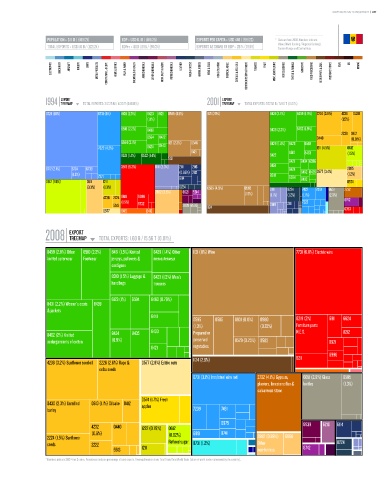
POPULATION ≥ 3.6 M / (108/21) GDP ≥ USD 6.1 b / (118/25) EXPORTS PER CAPITA ≥ USD 440 / (99/23) * Data are from 2008. Numbers indicate:
value (World Ranking / Regional Ranking).
TOTAL EXPORTS ≥ USD 1.6 b / (122/24) GDPpc ≥ USD 1,696 / (97/24) EXPORTS AS SHARE OF GDP ≥ 26 % (79/19) Eastern Europe and Central Asia.
ELECTRONICS MACHINERY AIRCRAFT bOILERS SHIPS METAL PRODUCTS CONSTR. MATL. & EqPT. HOME & OFFICE PULP & PAPER CHEMICALS & HEALTH AGROCHEMICALS OTHER CHEMICALS INOR. SALTS & ACIDS PETROCHEMICALS LEATHER MILK & CHEESE ANIMAL FIbERS MEAT & EGGS FISH & SEAFOOD TROPICAL AGRIC. CEREALS & vEG. OILS COTTON/RICE/SOY & OTHERS TObACCO FRUIT MISC. AGRICULTURE NOT CLASSIFIED TEXTILE & FAbRICS GARMENTS FOOD PROCESSING bEER/SPIRITS & CIGS. PRECIOUS STONES COAL OIL MINING
EXPORT EXPORT
1994 TREEMAP TOTAL EXPORTS: 212.25 M / 4.30 T (0.005%) 2001 TREEMAP TOTAL EXPORTS: 577.52 b / 5.90 T (0.01%)
Total Exports: 212.25 M / 4.30 T (0.005%) Total Exports: 577.52 M / 5.90 T (0.01%)
6725 (18%) 6731 (5%) 8431 (2.5%) 8423 8421 0585 (6.1%) 1121 (29%) 8431 (2.7%) 8459 (1.9%) 2224 (3.8%) 4236 0430
(1.1%) (1.5%)
8510 (2.2%) 8439 8439 (2.3%) 8462 (1.9%)
2239 0412
6594 8422 0440 (0.81%)
6584 (2.1%) 1121 (2.3%) 0546 8429 (1.4%) 8423 6589
7822 (4.2%) 8424 8443 1211 (4.5%) 0612
6421 8510 8463 (1.5%)
6521 (1.4%) 6522 (1.4%) 8422
5121
8421 8434 6596
6712 (2.1%) 6724 6733 3510 (6.3%) 0111 (3.3%) 2111 2116 8451 8424 8452 8435 0577 (3.4%) 2925
(1.2%) (0.95%) 2112 8310 (1.2%)
7371 6114 6594
0612 (7.6%) 0611 1211 8432 0574
(3.3%) (1.3%) 0224 0585 (4.5%) 0565 0111 0224 7422 7129 6651 2732
2882 (3.6%) 8921 5514 (1.5%)
4236 2224 6618 6996 (1.1%) (1.2%) (1.1%) (2.3%) 8742
(1.5%) 7223
5513 6732 2820 6595 1124 0149 2111
0577 6415 6413 6353
EXPORT
2008 TREEMAP TOTAL EXPORTS: 1.60 b / 15.56 T (0.01%)
Total Exports: 1.60 B / 15.56 T (0.01%)
8459 (2.8%) Other 8510 (2.2%) 8451 (1.5%) Knitted 8429 (1.4%) Other 1121 (11%) Wine 7731 (6.8%) Electric wire
knitted outerwear Footwear jerseys, pullovers & men outerwear
cardigans
8310 (1.5%) Luggage & 8423 (1.3%) Men's
handbags trousers
6123 (1%) 6594 8463 (0.76%)
8431 (2.2%) Women's coats 8439
& jackets
8441
0565 0585 8931 (0.8%) 0980 8219 (2%) 6911 6624
(1.3%) (0.72%) Furniture parts
8462 (2%) Knitted 8424 8435 8433 Prepared or N.E.S. 8212
undergarments of cotton (0.9%) preserved 0579 (0.75%) 0583 6921
8421 vegetables
6996
1124 (2.6%) 8211
4236 (3.2%) Sunflower seed oil 2226 (2.6%) Rape & 0577 (2.8%) Edible nuts
colza seeds
6731 (3.1%) Iron/steel wire rod 2732 (4.1%) Gypsum, 6651 (2.9%) Glass 6595
plasters, limestone flux & bottles (1.3%)
calcareous stone
0574 (1.7%) Fresh
0430 (2.3%) Unmilled 0813 (1.1%) Oilcake 0412 apples
barley 7239 7491
6975 8939 6210 6114
4232 0440 1222 (0.79%) 0612
(0.6%) (0.82%) 6991 8741
2224 (1.5%) Sunflower 2882 (0.99%) 6998
seeds 2222 Refined sugar 8731 (1.2%) Other 0224
5513 1211 non-ferrous 8742
base metals
* Numbers indicate SITC-4 rev 2 codes. Parenthesis indicate percentage of total exports. Treemap Headers show: Total Trade/Total World Trade (share of world trade represented by the country).