Page 250 - The Atlas of Economic Complexity
P. 250

MAPPING PATHS TO PROSPERITY  |  251


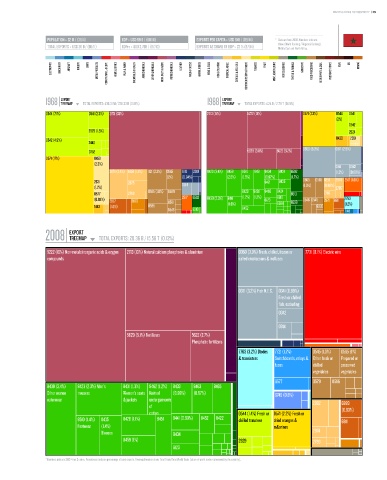
                   POPULATION ≥ 32 M / (36/4)  GDP ≥ USD 89 b / (60/10)   EXPORTS PER CAPITA ≥ USD 645 / (89/14)  *   Data are from 2008. Numbers indicate:
                                                                                                          value (World Ranking / Regional Ranking).
                   TOTAL EXPORTS ≥ USD 20 b / (66/11)  GDPpc ≥ USD 2,769 / (87/13)  EXPORTS AS SHARE OF GDP ≥ 23 % (87/14)    Middle East and North Africa.

                    ELECTRONICS  MACHINERY  AIRCRAFT   bOILERS   SHIPS   METAL PRODUCTS  CONSTR. MATL. & EqPT.  HOME & OFFICE  PULP & PAPER  CHEMICALS & HEALTH  AGROCHEMICALS  OTHER CHEMICALS  INOR. SALTS & ACIDS  PETROCHEMICALS  LEATHER  MILK & CHEESE  ANIMAL FIbERS  MEAT & EGGS  FISH & SEAFOOD  TROPICAL AGRIC.  CEREALS & vEG. OILS  COTTON/RICE/SOY & OTHERS  TObACCO  FRUIT  MISC. AGRICULTURE  NOT CLASSIFIED  TEXTILE & FAbRICS  GARMENTS  FOOD PROCESSING  bEER/SPIRITS & CIGS.  PRECIOUS STONES  COAL  OIL  MINING


                        EXPORT                                                      EXPORT
                  1968 TREEMAP  TOTAL EXPORTS: 436.31 M / 228.33 b (0.19%)    1988 TREEMAP  TOTAL EXPORTS: 4.24 b / 2.79 T (0.15%)
                                        Total Exports: 436.31 M / 228.33 B (0.19%)                   Total Exports: 4.24 B / 2.79 T (0.15%)
                  0544 (7.1%)     0541 (2.3%)  2713 (33%)                     2713 (15%)     5222 (13%)           0571 (7.3%)  0544  0541
                                                                                                                              (2%)
                                                                                                                                   0542
                                  2929 (1.5%)                                                                                      2924
                  0542 (4.9%)                                                                                                 0430  2631
                                  2440
                                  0752                                                       5629 (3.8%)  5622 (3.2%)  0360 (6.3%)  0371 (2.9%)
                  0571 (17%)        0459
                                    (2.3%)
                                                                                                                              0341  0342
                                          2874 (3.4%) 6851 (1.4%)  1121 (2.3%)  0545  6118  2919  8423 (3.4%) 8459  8510  8451 8434  8431  6592  (1.2%)  (0.86%)
                                                               (2%)  (0.94%)          (2.6%)  (1.5%)  (0.97%)  (1.7%)
                                    2631         2875                                               8421  8435    0565  0585 6851  2874 2517 (1.6%)
                                    (1.2%)                           0814                                         (1.6%)  (0.99%)  2785
                                    0577         2789   0565 (1.8%) 0589                   8429  8481  8462  8424  6513   2789
                                    (0.88%)  2877  2879         0561  2517  6592  8439 (2.3%)  8441  (1.2%) (1.2%)  6123  8310  6539  0546 0545  2871 6811  7763
                                    5513  (1.6%)        0585                          (1.6%)  8452      6584           6330      (1.2%)
                                                                0546     8310                                                    7148


                           EXPORT
                  2008 TREEMAP        TOTAL EXPORTS: 20.36 b / 15.56 T (0.13%)
                                                                 Total Exports: 20.36 B / 15.56 T (0.13%)
                   5222 (16%) Non-metals inorganic acids & oxygen  2713 (13%) Natural calcium phosphates & aluminium  0360 (3.9%) Fresh, chilled, frozen or  7731 (8.1%) Electric wire
                   compounds                                                              salted crustaceans & molluscs


                                                                                          0371 (3.2%) Fish N.E.S.  0341 (0.89%)
                                                                                                         Fresh or chilled
                                                                                                         fish, excluding
                                                                                                         fillets
                                                                                                         0342
                                                                                                         0814
                                                5629 (5.1%) Fertilizers  5622 (2.7%)
                                                                        Phosphatic fertilizers
                                                                                          7763 (3.2%) Diodes  7721 (1.7%)  0545 (1.3%)  0565 (1%)
                                                                                          & transistors  Switchboards, relays & Other fresh or  Prepared or
                                                                                                       fuses         chilled    preserved
                                                                                                                     vegetables  vegetables
                                                                                                       6577          0579    0586
                   8439 (3.4%)  8423 (2.3%) Men's  8431 (1.3%)  8462 (1.2%)  8433  8463  8465
                   Other women  trousers       Women's coats Knitted  (0.99%)  (0.97%)                 6749 (0.8%)
                   outerwear                   & jackets  undergarments                                              2882       6899
                                                         of
                                                         cotton                           0544 (1.4%) Fresh or 0571 (2.2%) Fresh or  (0.63%)
                              8510 (1.4%)  8435  8429 (1.1%)  8451  8441 (0.69%)  8452  8422  chilled tomatoes  dried oranges &  6811
                              Footwear  (1.4%)                                                         m&arines
                                       Blouses                   8434                                                2874
                                               8459 (1%)                                  2929                       2789
                                                                 6123

                  * Numbers indicate SITC-4 rev 2 codes. Parenthesis indicate percentage of total exports. Treemap Headers show: Total Trade/Total World Trade (share of world trade represented by the country).
   245   246   247   248   249   250   251   252   253   254   255