
Page 268 - The Atlas of Economic Complexity
P. 268
MAPPING PATHS TO PROSPERITY | 269
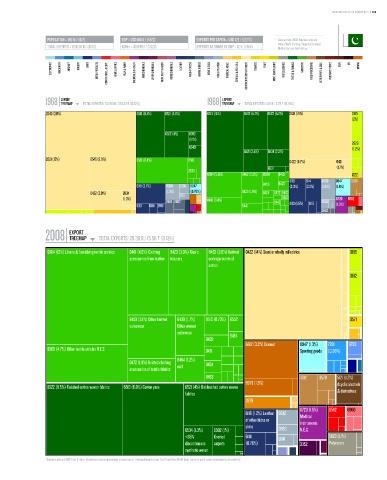
POPULATION ≥ 166 M / (6/2) GDP ≥ USD 164 b / (49/2) EXPORTS PER CAPITA ≥ USD 122 / (122/3) * Data are from 2008. Numbers indicate:
value (World Ranking / Regional Ranking).
TOTAL EXPORTS ≥ USD 20 b / (67/2) GDPpc ≥ USD 987 / (112/3) EXPORTS AS SHARE OF GDP ≥ 12 % (119/4) Middle East and North Africa.
ELECTRONICS MACHINERY AIRCRAFT bOILERS SHIPS METAL PRODUCTS CONSTR. MATL. & EqPT. HOME & OFFICE PULP & PAPER CHEMICALS & HEALTH AGROCHEMICALS OTHER CHEMICALS INOR. SALTS & ACIDS PETROCHEMICALS LEATHER MILK & CHEESE ANIMAL FIbERS MEAT & EGGS FISH & SEAFOOD TROPICAL AGRIC. CEREALS & vEG. OILS COTTON/RICE/SOY & OTHERS TObACCO FRUIT MISC. AGRICULTURE NOT CLASSIFIED TEXTILE & FAbRICS GARMENTS FOOD PROCESSING bEER/SPIRITS & CIGS. PRECIOUS STONES COAL OIL MINING
EXPORT EXPORT
1968 TREEMAP TOTAL EXPORTS: 731.88 M / 228.33 b (0.32%) 1988 TREEMAP TOTAL EXPORTS: 4.51 b / 2.79 T (0.16%)
Total Exports: 731.88 M / 228.33 B (0.32%) Total Exports: 4.51 B / 2.79 T (0.16%)
2640 (26%) 6513 (8.4%) 6521 (4.6%) 6513 (14%) 6592 (5.7%) 6522 (5.2%) 2631 (19%) 0615
(2%)
6522 (4%) 6592
(1.1%)
2929
6549 (1.2%)
6521 (3.5%) 6534 (2.3%)
2631 (15%) 6545 (9.9%) 6581 (8.4%) 8510 0422 (5.7%) 0421
6531 (1.7%)
2633
6584 (5.6%) 8462 (2.3%) 6589 8435 1222
6116 6114 0360 8947 0579
6118 (3.7%) 0360 0350 8947 8459 8423 (2.3%) (2.2%) (1.8%) (1.6%)
0422 (3.9%) 2634 (1.3%) 2911 (0.76%) 8439 (1.9%) 8424 8472 8463
(1.3%) 6560 8720 6582
2681 2682 8481 (3.4%) 8442 0350
6113 6114 2919 8441 6113 (1.5%) 6115 (1.3%)
2682
EXPORT
2008 TREEMAP TOTAL EXPORTS: 20.30 b / 15.56 T (0.13%)
Total Exports: 20.30 B / 15.56 T (0.13%)
6584 (12%) Linens & furnishing textile articles 8481 (4.2%) Clothing 8423 (3.9%) Men's 8462 (3.8%) Knitted 0422 (14%) Semi or wholly milled rice 0615
accessories from leather trousers undergarments of
cotton
0612
8459 (3.1%) Other knitted 8439 (1.7%) 8510 (0.73%) 6552 0571
outerwear Other women
outerwear 8451
8429
6612 (3.2%) Cement 8947 (1.3%) 7281 6783
6589 (4.7%) Other textile articles N.E.S. 8471 Sporting goods (0.65%)
8464 (1.2%)
8472 (1.8%) Knitted clothing 8424
accessories of textile fabrics null
8463 4312 0579 5121 (1.2%)
8973 (1.3%) Acyclic alcohols
6522 (8.5%) Finished cotton woven fabrics 6513 (6.8%) Cotton yarn 6521 (4%) Unbleached cotton woven
fabrics & derivatives
2879
8720 (1.5%) 6582 6960
6116 (1.2%) Leather 0342 Medical
of other hides or instruments
skins
6534 (1.3%) 6592 (1%) 0360 N.E.S.
<85% Knotted 6114 0341 5823 (1.1%)
discontinuous carpets (0.76%) 3352 Polyesters
synthetic woven
fabrics
* Numbers indicate SITC-4 rev 2 codes. Parenthesis indicate percentage of total exports. Treemap Headers show: Total Trade/Total World Trade (share of world trade represented by the country).