Page 270 - The Atlas of Economic Complexity
P. 270

MAPPING PATHS TO PROSPERITY  |  271


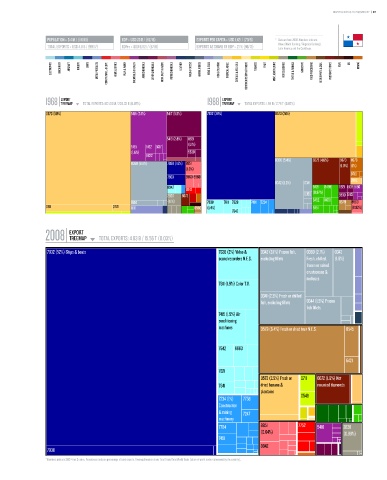
                   POPULATION ≥ 3.4 M / (110/18)  GDP ≥ USD 23 b / (92/15)  EXPORTS PER CAPITA ≥ USD 1,421 / (70/8)  *   Data are from 2008. Numbers indicate:
                                                                                                          value (World Ranking / Regional Ranking).
                   TOTAL EXPORTS ≥ USD 4.8 b / (99/17)  GDPpc ≥ USD 6,821 / (57/8)  EXPORTS AS SHARE OF GDP ≥ 21 % (96/13)    Latin America and the Caribbean.

                    ELECTRONICS  MACHINERY  AIRCRAFT   bOILERS   SHIPS   METAL PRODUCTS  CONSTR. MATL. & EqPT.  HOME & OFFICE  PULP & PAPER  CHEMICALS & HEALTH  AGROCHEMICALS  OTHER CHEMICALS  INOR. SALTS & ACIDS  PETROCHEMICALS  LEATHER  MILK & CHEESE  ANIMAL FIbERS  MEAT & EGGS  FISH & SEAFOOD  TROPICAL AGRIC.  CEREALS & vEG. OILS  COTTON/RICE/SOY & OTHERS  TObACCO  FRUIT  MISC. AGRICULTURE  NOT CLASSIFIED  TEXTILE & FAbRICS  GARMENTS  FOOD PROCESSING  bEER/SPIRITS & CIGS.  PRECIOUS STONES  COAL  OIL  MINING


                        EXPORT                                                      EXPORT
                  1968 TREEMAP  TOTAL EXPORTS: 162.06 M / 228.33 b (0.07%)    1988 TREEMAP  TOTAL EXPORTS: 1.99 b / 2.79 T (0.07%)
                                        Total Exports: 162.06 M / 228.33 B (0.07%)                   Total Exports: 1.99 B / 2.79 T (0.07%)
                  0573 (50%)                      5415 (7.4%)  5417 (5.5%)    7932 (38%)               0573 (24%)


                                                               5413 (2.8%)  8921
                                                                       (1.1%)
                                                  5155  5162 5137
                                                  (1.6%)               5530
                                                       8822
                                                                                                       0360 (5.4%)   6672 (4.6%)  6673 8973
                                                  0360 (8.9%)  7938 (1.6%) 8851                                                 (1.8%) (1%)
                                                                      (1.3%)
                                                                                                                                    9710
                                                               7933   6960 8960                                                     2882
                                                                                                       0342 (5.2%)  0341
                                                               8942                                                  8421  8459  8921 5139 5156
                                                                      6842
                                                                                                                  0350  (0.97%)  5530 5413
                                                               2820  6673
                                                  0814         (1.1%)         7638  7611 7628  7491 7234             8462  8439  0579  8960
                  0611                     0721   0111                   0980  (1.4%)                                8451           (0.92%)
                                                                                       7642


                           EXPORT
                  2008 TREEMAP        TOTAL EXPORTS: 4.83 b / 15.56 T (0.03%)
                                                                 Total Exports: 4.83 B / 15.56 T (0.03%)
                   7932 (52%) Ships & boats                                       7638 (2%) Video &  0342 (3.1%) Frozen fish,  0360 (2.1%)  0343
                                                                                  sound recorders N.E.S.  excluding fillets  Fresh, chilled,  (1.6%)
                                                                                                                   frozen or salted
                                                                                                                   crustaceans &
                                                                                                                   molluscs
                                                                                  7611 (1.9%) Color T.V.

                                                                                                  0341 (2.3%) Fresh or chilled
                                                                                                  fish, excluding fillets  0344 (1.5%) Frozen
                                                                                                                   fish fillets
                                                                                  7415 (1.5%) Air
                                                                                  conditioning
                                                                                  machines        0579 (6.4%) Fresh or dried fruit N.E.S.  0545


                                                                                  7642  8983

                                                                                                                                  6421

                                                                                  7621
                                                                                                  0573 (2.5%) Fresh or  0711  6672 (1.6%) Not
                                                                                  7641            dried banana &       mounted diamonds
                                                                                                  plantains
                                                                                  7234 (1%)  7758                0548
                                                                                  Construction
                                                                                  & mining  7247
                                                                                  machinery
                                                                                  7784            8851          7752   5416      2820
                                                                                                  (0.64%)                        (0.88%)
                                                                                  7491
                                                                                                  8842
                   7938
                  * Numbers indicate SITC-4 rev 2 codes. Parenthesis indicate percentage of total exports. Treemap Headers show: Total Trade/Total World Trade (share of world trade represented by the country).
   265   266   267   268   269   270   271   272   273   274   275