
Page 278 - The Atlas of Economic Complexity
P. 278
MAPPING PATHS TO PROSPERITY | 279
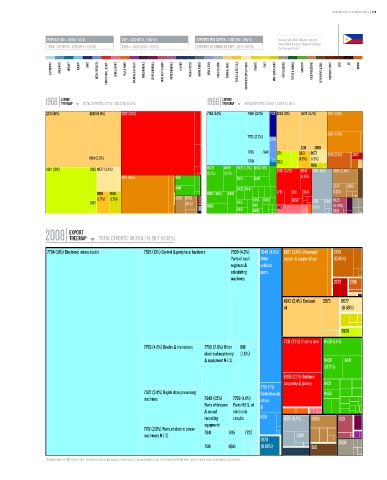
POPULATION ≥ 90 M / (12/4) GDP ≥ USD 167 b / (48/10) EXPORTS PER CAPITA ≥ USD 545 / (94/14) * Data are from 2008. Numbers indicate:
value (World Ranking / Regional Ranking).
TOTAL EXPORTS ≥ USD 49 b / (54/11) GDPpc ≥ USD 1,844 / (95/12) EXPORTS AS SHARE OF GDP ≥ 30 % (66/11) East Asia and Pacific.
ELECTRONICS MACHINERY AIRCRAFT bOILERS SHIPS METAL PRODUCTS CONSTR. MATL. & EqPT. HOME & OFFICE PULP & PAPER CHEMICALS & HEALTH AGROCHEMICALS OTHER CHEMICALS INOR. SALTS & ACIDS PETROCHEMICALS LEATHER MILK & CHEESE ANIMAL FIbERS MEAT & EGGS FISH & SEAFOOD TROPICAL AGRIC. CEREALS & vEG. OILS COTTON/RICE/SOY & OTHERS TObACCO FRUIT MISC. AGRICULTURE NOT CLASSIFIED TEXTILE & FAbRICS GARMENTS FOOD PROCESSING bEER/SPIRITS & CIGS. PRECIOUS STONES COAL OIL MINING
EXPORT EXPORT
1968 TREEMAP TOTAL EXPORTS: 1.07 b / 228.33 b (0.47%) 1988 TREEMAP TOTAL EXPORTS: 8.58 b / 2.79 T (0.31%)
Total Exports: 1.07 B / 228.33 B (0.47%) Total Exports: 8.58 B / 2.79 T (0.31%)
2231 (15%) 4243 (8.9%) 2472 (30%) 7764 (14%) 7599 (3.2%) 7921 4243 (6%) 0573 (5.7%) 2871 (4.6%)
6821 (4.4%)
7763 (2.2%)
6716
2231 2659
7788 7648 0711 0813 0577 2816 (2.4%) 2872
0611 (2.3%) (1.2%) (1.2%)
7768 0612
0612 (13%) 0615 0577 (3.2%) 8439 8459 8423 (1.2%) 8463 (1%) 2483 (3.2%) 6342 2655 0589 (2.4%)
0360 (4%)
(2.7%) (2.1%)
2871 (12%) 8471 8510 8481 (1.5%)
8481 8433 8441 0579 0585
0813 2655 8997 (1.6%) 8465 7731 8211 6341 (1.2%)
(1.7%) (1.7%) 0589 0586 6584 8452 6353 5629
0812 (1.1%) 8431 0371 0341
8462 8471 8851 (1.1%) (0.97%)
8421 8435 5222
EXPORT
2008 TREEMAP TOTAL EXPORTS: 49.20 b / 15.56 T (0.32%)
Total Exports: 49.20 B / 15.56 T (0.32%)
7764 (31%) Electronic microcircuits 7525 (13%) Control & peripheral hardware 7599 (4.3%) 7849 (4.8%) 6821 (3.4%) Unwrought 9710
Parts of cash Other copper & copper alloys (0.95%)
registers & vehicles
calculating parts
machines
2872 2816
4243 (2.4%) Coconut 0573 0577
oil (0.56%)
2929
7731 (2.1%) Electric wire 8459 (1.1%)
7763 (4.2%) Diodes & transistors 7788 (2.8%) Other 8811
electrical machinery (1.6%)
& equipment N.E.S. 8439 8441
(0.71%)
6353 (2.1%) Builders`
carpentry & joinery 8431
7721 (1%)
7522 (3.4%) Digital data processing Switchboards, 8463
machines 7649 (1.5%) 7768 (1.4%) relays
Parts of telecom Parts N.E.S. of &
& sound electronic fuses
recording circuits 6251 0371 (0.7%) 0589 5231
equipment
7712 (2.9%) Parts of electric power
machinery N.E.S. 7641 7415 7722 0342
7929 2820
7591 8841 (0.66%) 5121
* Numbers indicate SITC-4 rev 2 codes. Parenthesis indicate percentage of total exports. Treemap Headers show: Total Trade/Total World Trade (share of world trade represented by the country).