
Page 280 - The Atlas of Economic Complexity
P. 280
MAPPING PATHS TO PROSPERITY | 281
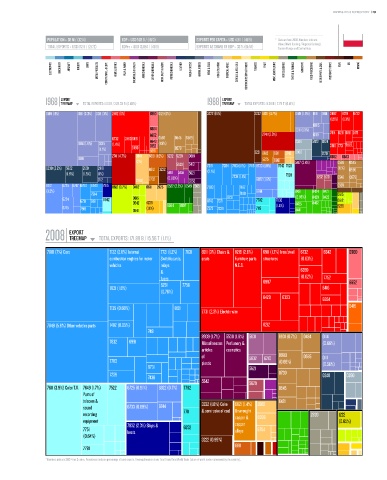
POPULATION ≥ 38 M / (32/4) GDP ≥ USD 528 b / (18/3) EXPORTS PER CAPITA ≥ USD 4,511 / (41/9) * Data are from 2008. Numbers indicate:
value (World Ranking / Regional Ranking).
TOTAL EXPORTS ≥ USD 172 b / (27/2) GDPpc ≥ USD 13,857 / (41/9) EXPORTS AS SHARE OF GDP ≥ 33 % (61/14) Eastern Europe and Central Asia.
ELECTRONICS MACHINERY AIRCRAFT bOILERS SHIPS METAL PRODUCTS CONSTR. MATL. & EqPT. HOME & OFFICE PULP & PAPER CHEMICALS & HEALTH AGROCHEMICALS OTHER CHEMICALS INOR. SALTS & ACIDS PETROCHEMICALS LEATHER MILK & CHEESE ANIMAL FIbERS MEAT & EGGS FISH & SEAFOOD TROPICAL AGRIC. CEREALS & vEG. OILS COTTON/RICE/SOY & OTHERS TObACCO FRUIT MISC. AGRICULTURE NOT CLASSIFIED TEXTILE & FAbRICS GARMENTS FOOD PROCESSING bEER/SPIRITS & CIGS. PRECIOUS STONES COAL OIL MINING
EXPORT EXPORT
1968 TREEMAP TOTAL EXPORTS: 1.03 b / 228.33 b (0.45%) 1988 TREEMAP TOTAL EXPORTS: 11.38 b / 2.79 T (0.41%)
Total Exports: 1.03 B / 228.33 B (0.45%) Total Exports: 11.38 B / 2.79 T (0.41%)
0149 (11%) 0111 (3.3%) 0011 (3%) 2482 (6%) 6953 0121 (6%) 3222 (16%) 3232 6821 (3.7%) 0149 (1.9%) 0111 0114 2482 8219 6732
(1.5%) (1.3%)
0015
6664 0011 (1.3%)
6652 2741 (3.9%) 0118 7414 8211 6911 2471
6732 24836416 0586 0545 0589
0114 (1.9%) 0015 (1.4%) 6643 (1.9%) 0344 5922 0224 3510 7731 6997
7852
(1.1%) 2460 5981 0579 3221 6612 0360
2741 (4.7%) 6841 6861 (1.6%) 5232 5239 0819 6811 2742 2120 6652 6643
0118 5225
(2%) 5629 5413 6861 5417 (3.4%) 0586 0545
0230 (2.2%) 5922 2120 2919 6612 3232 7219 7284 7413 (1.1%) 7416 6733 (1.9%) 7642 7525 (1.1%) 0585
(1.8%) (1.5%) (1%) 5148 5155 5621 (2.1%) 7234 (1.1%) 7528 5232 5231
2112 2783 2732 (0.95%) 3352 6822 (1.6%) 0546 0579
6712 6725 6747 6760 6940 7915 0612 (3.7%) 0482 0611 2925 6522 (2.2%) 6549 2665 7783 7187 0565
(3.2%) 6744 8431 8424 8421
7914 7188 0615
6724 8942 0615 6731 7782 7932 (0.85%) 8429 8423 0612
6731 7491 0542 4239 8743 7371 8435 8462
6745 7919 0541 (1.1%) 6584 8997 7272 7239 7119 (1.4%) 8441 2226
EXPORT
2008 TREEMAP TOTAL EXPORTS: 171.88 b / 15.56 T (1.1%)
Total Exports: 171.88 B / 15.56 T (1.1%)
7810 (7%) Cars 7132 (2.8%) Internal 7721 (1.2%) 7831 8211 (3%) Chairs & 8219 (2.6%) 6911 (1.7%) Iron/steel 6732 6842 6960
combustion engines for motor Switchboards, seats Furniture parts structures (0.63%)
vehicles relays N.E.S.
& 6359
fuses 6997 (0.62%) 7752
6251 7758 6652
7821 (1.6%) 6416
(0.76%)
6428 6353 6924
6415
7139 (0.66%) 8121
7731 (2.3%) Electric wire
7849 (5.9%) Other vehicles parts 7492 (0.65%) 8212
7491
8939 (1.7%) 5530 (1.6%) 5831 8931 (0.7%) 0484 0114
7832 6991 Miscellaneous Perfumery & (0.66%)
articles cosmetics
of 5832 6210 0980 0585 0111
7783 plastic (0.66%)
6731 5621 (0.56%)
7239 0730 0240 0350
7436
5542 5629
7611 (3.9%) Color T.V. 7649 (1.7%) 7522 6725 (0.91%) 6822 (0.7%) 7782 0545
Parts of
telecom & 3232 (1.8%) Coke 6821 (1.4%) 2882 6421
sound 6733 (0.89%) 6744 & semi-coke of coal Unwrought
recording 7711 copper & 6998 2820 1222
equipment (0.65%)
7932 (2.3%) Ships & 6252 copper
7751 boats alloys 6794
(0.64%)
3222 (0.99%)
6811
7781
* Numbers indicate SITC-4 rev 2 codes. Parenthesis indicate percentage of total exports. Treemap Headers show: Total Trade/Total World Trade (share of world trade represented by the country).