
Page 306 - The Atlas of Economic Complexity
P. 306
MAPPING PATHS TO PROSPERITY | 307
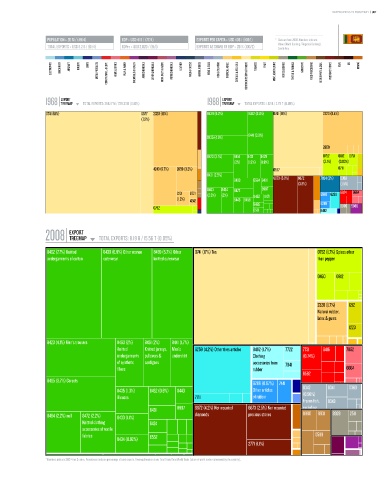
POPULATION ≥ 20 M / (49/4) GDP ≥ USD 41 b / (77/4) EXPORTS PER CAPITA ≥ USD 406 / (100/1) * Data are from 2008. Numbers indicate:
value (World Ranking / Regional Ranking).
TOTAL EXPORTS ≥ USD 8.2 b / (81/4) GDPpc ≥ USD 2,020 / (91/1) EXPORTS AS SHARE OF GDP ≥ 20 % (100/2) South Asia.
ELECTRONICS MACHINERY AIRCRAFT bOILERS SHIPS METAL PRODUCTS CONSTR. MATL. & EqPT. HOME & OFFICE PULP & PAPER CHEMICALS & HEALTH AGROCHEMICALS OTHER CHEMICALS INOR. SALTS & ACIDS PETROCHEMICALS LEATHER MILK & CHEESE ANIMAL FIbERS MEAT & EGGS FISH & SEAFOOD TROPICAL AGRIC. CEREALS & vEG. OILS COTTON/RICE/SOY & OTHERS TObACCO FRUIT MISC. AGRICULTURE NOT CLASSIFIED TEXTILE & FAbRICS GARMENTS FOOD PROCESSING bEER/SPIRITS & CIGS. PRECIOUS STONES COAL OIL MINING
EXPORT EXPORT
1968 TREEMAP TOTAL EXPORTS: 358.17 M / 228.33 b (0.16%) 1988 TREEMAP TOTAL EXPORTS: 1.52 b / 2.79 T (0.05%)
Total Exports: 358.17 M / 228.33 B (0.16%) Total Exports: 1.52 B / 2.79 T (0.05%)
0741 (61%) 0577 2320 (16%) 8439 (6.2%) 8462 (3.4%) 0741 (18%) 2320 (8.4%)
(7.9%)
8441 (3.3%)
8435 (4.9%)
2659
8423 (3.1%) 8451 8421 8429 0752 0812 0751
(2%) (1.9%) (1.9%) (2.1%) (0.83%)
4243 (5.7%) 2659 (3.2%) 0577 0711
8431 (2.5%)
8433 6584 8481 6673 (5.8%) 6672 7924 (2%) 0360
(3.8%) (1.5%)
8463 8434 8472 8997
2231 0721 (2.3%) (2%) 6940 6259 6624 6664
(1.2%) 4242 8443 8459 8452 8471
8465 6289 8999 5989
0752
6581 8482
EXPORT
2008 TREEMAP TOTAL EXPORTS: 8.19 b / 15.56 T (0.05%)
Total Exports: 8.19 B / 15.56 T (0.05%)
8462 (7.7%) Knitted 8439 (6.9%) Other women 8459 (5.7%) Other 0741 (17%) Tea 0752 (1.7%) Spices other
undergarments of cotton outerwear knitted outerwear than pepper
0460 0812
2320 (1.7%) 1212
Natural rubber,
latex & gums
1223
8423 (4.1%) Men's trousers 8463 (2%) 8451 (2%) 8441 (1.7%)
Knitted Knitted jerseys, Men's 6259 (4.2%) Other tires articles 8482 (1.7%) 7722 7731 6416 7852
undergarments pullovers & undershirt Clothing (0.74%)
of synthetic cardigans accessories from 7641
fibers rubber 6664
6582
8465 (3.7%) Corsets
6289 (0.97%) 7441
8435 (1.3%) 8452 (0.8%) 8443 Other articles 0342 0341 0360
Blouses 7711 of rubber (0.98%)
Frozen fish, 0343
8431 8997 6672 (4.2%) Not mounted 6673 (2.5%) Not mounted excluding
fillets
8464 (2.2%) null 8472 (2.2%) 8433 (1.1%) diamonds precious stones 0980 8931 8928 2511
Knitted clothing 8424
accessories of textile
fabrics 6552 0589
8434 (0.92%)
2771 (1.1%)
* Numbers indicate SITC-4 rev 2 codes. Parenthesis indicate percentage of total exports. Treemap Headers show: Total Trade/Total World Trade (share of world trade represented by the country).