
Page 310 - The Atlas of Economic Complexity
P. 310
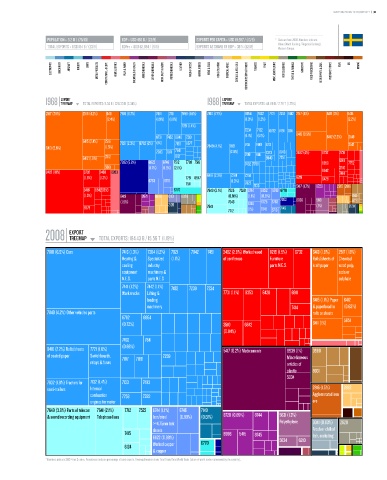
MAPPING PATHS TO PROSPERITY  |  311


                   POPULATION ≥ 9.2 M / (75/10)  GDP ≥ USD 488 b / (22/9)  EXPORTS PER CAPITA ≥ USD 19,957 / (13/8)  *   Data are from 2008. Numbers indicate:
                                                                                                          value (World Ranking / Regional Ranking).
                   TOTAL EXPORTS ≥ USD 184 b / (23/9)  GDPpc ≥ USD 52,884 / (9/6)  EXPORTS AS SHARE OF GDP ≥ 38 % (52/8)    Western Europe.

                    ELECTRONICS  MACHINERY  AIRCRAFT   bOILERS   SHIPS   METAL PRODUCTS  CONSTR. MATL. & EqPT.  HOME & OFFICE  PULP & PAPER  CHEMICALS & HEALTH  AGROCHEMICALS  OTHER CHEMICALS  INOR. SALTS & ACIDS  PETROCHEMICALS  LEATHER  MILK & CHEESE  ANIMAL FIbERS  MEAT & EGGS  FISH & SEAFOOD  TROPICAL AGRIC.  CEREALS & vEG. OILS  COTTON/RICE/SOY & OTHERS  TObACCO  FRUIT  MISC. AGRICULTURE  NOT CLASSIFIED  TEXTILE & FAbRICS  GARMENTS  FOOD PROCESSING  bEER/SPIRITS & CIGS.  PRECIOUS STONES  COAL  OIL  MINING


                        EXPORT                                                      EXPORT
                  1968 TREEMAP  TOTAL EXPORTS: 5.34 b / 228.33 b (2.34%)      1988 TREEMAP  TOTAL EXPORTS: 48.89 b / 2.79 T (1.75%)
                                         Total Exports: 5.34 B / 228.33 B (2.34%)                    Total Exports: 48.89 B / 2.79 T (1.75%)
                  2517 (7.9%)   2518 (4.2%)  6411  7810 (6.7%)  7491  7411  7499 (1.5%)  7810 (7.7%)  6954  7832  7721 7452 7442 2517 (4%)  6411 (3%)  6415
                                         (2.4%)            (1.9%)  (1.8%)                   (1.3%) (1.2%)                         (2.2%)
                                                                     7281 (1.4%)
                                                                                            7234  7132  6782 7491 7841
                                                           6731  7452 6940 7213             (1.1%)  (1.1%)     6413 (3.5%)  6412 (2.2%)  2518
                                6415 (2.4%)  2516  7821 (2.3%) 6782 (2%) (1%)  7126  6577   7451  7449 6731                        2512
                  6413 (5.6%)           (1.5%)                                7849 (4.1%)  7821
                                                           7283 7371  7841             (2.8%)  7416  7441  7373  8743  2482 (4%)  6732  7731
                                6412 (1.9%)  2512                 8121                              6940  7251
                                              7932 (5.8%)  6822  6746  7512  7788 7518      7492 7758                    6353  6911  7752
                                        5981            (1.7%)  (1.3%) (2.1%)                                                  3510
                  2482 (10%)    6732  2460  6953                              6418 (2.3%)  7284                          6842  7414
                                (1.8%)  (1.3%)                        7781 8947             7259               8219      6428
                                                        6783  6716                     (1.3%)
                                                                      7511                  7822  7133         5417 (1.7%)  8720  2815 2816
                                6416  68426353                    6770        7649 (2.1%)  7525  7528 6744  6822  6749 6770
                                (1.3%)        6419    2671  6998  0113  8928          (0.81%)  (1.1%)  (0.8%)                       0484
                                              (1.9%)            2120                  7643   6746  6725 6783  7932  8939  5831      0730
                                6973                                          7641           (1%)  6745  7149          (1%)        2120
                                                                                      7712            6713


                           EXPORT
                  2008 TREEMAP        TOTAL EXPORTS: 184.43 b / 15.56 T (1.19%)
                                                                 Total Exports: 184.43 B / 15.56 T (1.19%)
                   7810 (6.9%) Cars           7416 (1.3%)  7284 (1.2%)  7821  7842  7491  2482 (2.9%) Worked wood  8219 (1.5%)  6732  6413 (1.9%)  2517 (1.8%)
                                              Heating &  Specialized  (1.1%)        of coniferous    Furniture       Rolls/sheets of Chemical
                                              cooling   industry                                     parts N.E.S.    kraft paper  wood pulp,
                                              equipment  machinery &                                                           soda or
                                              N.E.S.    parts N.E.S                                                            sulphate
                                              7441 (1.2%)  7442 (1.1%)  7452  7239  7234
                                              Work trucks  Lifting &                7731 (1.1%)  6353  6428   6911
                                                        loading                                                      6415 (1.1%) Paper  6412
                                                        machinery                                             7414   & paperboad in  (0.63%)
                   7849 (4.2%) Other vehicles parts                                                                  rolls or sheets
                                              6782    6954                                                                       5851
                                              (0.72%)                               3510    6842                     6411 (1%)
                                                                                    (0.84%)
                                              7492     7841
                                              (0.66%)
                   6418 (2.2%) Rolls/sheets  7721 (1.6%)                            5417 (6.2%) Medicaments  8939 (1%)  0980
                   of coated paper  Switchboards,  7187  7188  7259                                         Miscellaneous
                                   relays & fuses                                                           articles of
                                                                                                            plastic  8931
                                                                                                            5334
                   7832 (1.8%) Tractors for  7132 (1.4%)  7133  7493
                   semi-trailers   Internal                                                                          2816 (1.5%)  2882
                                   combustion  7758   7283                                                           Agglomerated iron
                                   engines for motor                                                                 ore
                   7649 (3.8%) Parts of telecom vehicles  7712  7523  6744 (1.1%)  6746  7149
                                     7641 (2.1%)
                   & sound recording equipment  Telephone lines  Iron/steel  (0.89%)  (0.61%)  8720 (0.89%)  8744  5831 (1.3%)
                                                          >=4.75mm tick                                  Polyethylene  0341 (0.93%)  2820
                                                          sheets                                                     Fresh or chilled
                                               7415                                 8996  5415  8745
                                                          6822 (0.88%)                                   5834   6210  fish, excluding
                                               8124       Worked copper     6770                                     fillets
                                                          & copper
                                                          alloys
                  * Numbers indicate SITC-4 rev 2 codes. Parenthesis indicate percentage of total exports. Treemap Headers show: Total Trade/Total World Trade (share of world trade represented by the country).