
Page 312 - The Atlas of Economic Complexity
P. 312
MAPPING PATHS TO PROSPERITY | 313
POPULATION ≥ 7.6 M / (78/12) GDP ≥ USD 502 b / (21/8) EXPORTS PER CAPITA ≥ USD 26,283 / (10/5) * Data are from 2008. Numbers indicate:
value (World Ranking / Regional Ranking).
TOTAL EXPORTS ≥ USD 201 b / (19/8) GDPpc ≥ USD 65,699 / (3/2) EXPORTS AS SHARE OF GDP ≥ 40 % (47/6) Western Europe.
ELECTRONICS MACHINERY AIRCRAFT bOILERS SHIPS METAL PRODUCTS CONSTR. MATL. & EqPT. HOME & OFFICE PULP & PAPER CHEMICALS & HEALTH AGROCHEMICALS OTHER CHEMICALS INOR. SALTS & ACIDS PETROCHEMICALS LEATHER MILK & CHEESE ANIMAL FIbERS MEAT & EGGS FISH & SEAFOOD TROPICAL AGRIC. CEREALS & vEG. OILS COTTON/RICE/SOY & OTHERS TObACCO FRUIT MISC. AGRICULTURE NOT CLASSIFIED TEXTILE & FAbRICS GARMENTS FOOD PROCESSING bEER/SPIRITS & CIGS. PRECIOUS STONES COAL OIL MINING
EXPORT EXPORT
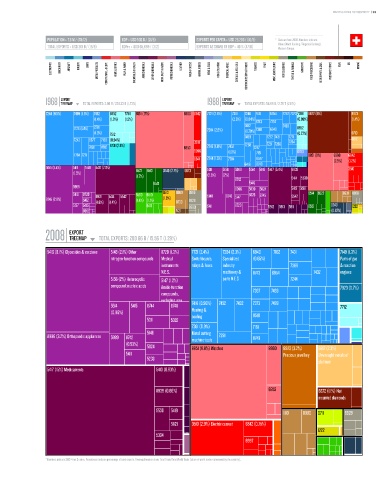
1968 TREEMAP TOTAL EXPORTS: 3.96 b / 228.33 b (1.73%) 1988 TREEMAP TOTAL EXPORTS: 58.99 b / 2.79 T (2.11%)
Total Exports: 3.96 B / 228.33 B (1.73%) Total Exports: 58.99 B / 2.79 T (2.11%)
7244 (9.5%) 7499 (1.9%) 7452 8852 7788 8851 (17%) 8960 6842 7721 (2.6%) 7361 7246 7416 6954 7267 7373 7788 6672 (11%) 8973
(1.4%) (1.9%) (1.5%) (2.6%) (0.84%) 8743 7252 (0.99%) (1.4%)
7126 (1.4%) 7281 7284 (2.6%) 7492 7369 6940 7493 8852
(0.79%)
(1.3%) 7512 (0.77%) 9710
7243 6577 7188 (0.94%) 3510 7499 7272 7431 7271 6812
7264
7491 8812 8731 (2.8%) 6953 7245 (1.6%) 7452 7268 7247 7281 7269
6996 (1.3%) 6783
7784 7271 7161 8851 (6%) 8960 6842
6341 7244 (1.5%) 7784 6577 (2.5%) (1.2%)
6418 8749
5155 (5.4%) 5411 5148 5417 (7.3%) 5311 5156 5989 5514 5146 5417 (5.4%) 8939 3510
(1.5%) 6522 6513 0240 (2.7%) 6673
(1.7%) (2.6%) (2%) 5414 5530
8742
6521 5416
5989 8996 5839 5824 5413 5139
5416 8720 8921 5414 5542 6560 8510 5513 0980 2665 5148 8748 5826 8745 5542 6514 6522 8931 8928
8745 (2.8%) 5162 (1.6%) (1.4%) (1.4%) (1.1%) (1.3%) 0730 8928 5147
5137 5415 8471 8993 5411 8720 5912 5913 5911 6513 0240 1222
8996 5121 (0.87%)
EXPORT
2008 TREEMAP TOTAL EXPORTS: 200.66 b / 15.56 T (1.29%)
Total Exports: 200.66 B / 15.56 T (1.29%)
5416 (8.1%) Glycosides & vaccines 5148 (2.1%) Other 8720 (1.3%) 7721 (2.4%) 7284 (2.3%) 6940 7162 7431 7149 (1.3%)
nitrogen-function compounds Medical Switchboards, Specialized (0.65%) Parts of gas
instruments relays & fuses industry 7369 & reaction
N.E.S. machinery & 8743 6954 7432 engines
5156 (2%) Heterocyclic 5147 (1.2%) parts N.E.S 7244
compound; nucleic acids Amide-function 7923 (0.7%)
compounds, 7367 7493
excluding urea
5514 5415 8744 8748 7416 (0.96%) 7452 7492 7373 7499 7712
(0.96%) Heating & 9510
5311 5332 cooling
equipment
7361 (0.9%) 7161
5146 N.E.S.
Metal cutting
8996 (3.2%) Orthopaedic appliances 5989 8742 machine-tools 7281 8749
(0.53%)
5824 8851 (8.8%) Watches 8960 8973 (3.2%) 6812 (2.3%)
5411 Precious jewellery Unwrought metals of
5233
platinum
5417 (15%) Medicaments 5413 (0.93%)
8939 (0.86%) 6953 6672 (1.1%) Not
mounted diamonds
5530 5419 1110 0980 0711 8928
5821 3510 (2.9%) Electric current 6842 (0.75%)
1222
5334
6997
* Numbers indicate SITC-4 rev 2 codes. Parenthesis indicate percentage of total exports. Treemap Headers show: Total Trade/Total World Trade (share of world trade represented by the country).